An analytics team employed at a leading credit card company is utilizing data analytics to identify unusual credit card purchases.
They have created the following visual. How many extreme outliers exists in this dataset?
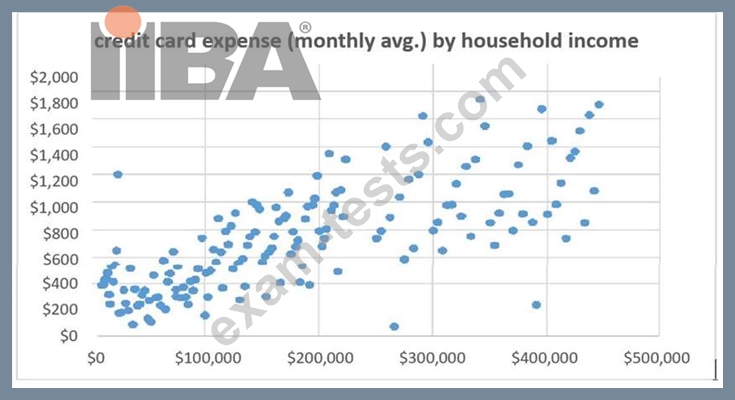
Correct Answer: C
Explanation
According to the Business Data Analytics (IIBA®- CBDA) principles, extreme outliers in a dataset can be identified visually on a scatter plot as points that are distinctly separate from the bulk of the data. In this visual, there are three points that are significantly higher on the y-axis (credit card expense) relative to their position on the x-axis (household income), indicating unusual credit card purchases. References: The identification and interpretation of outliers is a standard practice in data analytics and is covered under the Business Data Analytics (IIBA®- CBDA) learning resources.
