
Question 46
The Beveridge curve displays the relationship between the unemployment rate and the job vacancy rate (the number of unfilled jobs divided by the labor force). A government official wants to forecast the job vacancy rate for next month to see whether jobs posted now are likely to be filled. The official runs a simple regression using monthly U.S. data from 20012013; the results are given below.
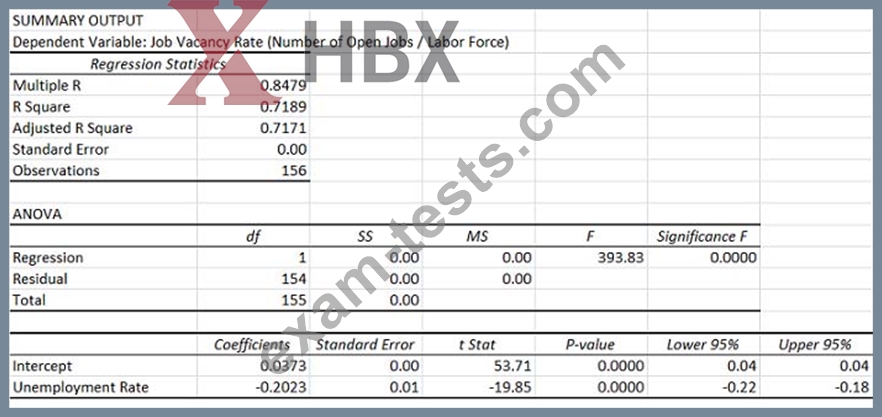
If the unemployment rate next month is expected to be 6.6% and the vacancy rate this month was 2.58%, by how much is the vacancy rate forecasted to change? Note that percentages are given as values between 0 and 1.
If the unemployment rate next month is expected to be 6.6% and the vacancy rate this month was 2.58%, by how much is the vacancy rate forecasted to change? Note that percentages are given as values between 0 and 1.
Question 47
A shop owner wants to determine the effect of a new marketing strategy on the number of customers visiting the shop. What information should the shop owner consider when deciding whether to conduct a one-sided or two-sided hypothesis testing?
Question 48
A weight loss clinic had 1,000 clients last year. The distribution of the changes in clients' weights is shown below.
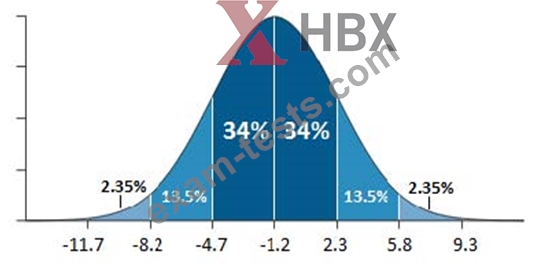
Which of the following Excel formulas would correctly calculate the 95% confidence interval for the true average change in weight? Please note that the formula for calculating confidence intervals in Excel is =CONFIDENCE.NORM(alpha, standard_dev, size).
Which of the following Excel formulas would correctly calculate the 95% confidence interval for the true average change in weight? Please note that the formula for calculating confidence intervals in Excel is =CONFIDENCE.NORM(alpha, standard_dev, size).
Question 49
Which of the following methods for valuing and expensing inventory is NOT allowed under the International Financial Reporting Standards (IFRS)?
Question 50
For valuation purposes, the opportunity cost and inflation are two main concepts that explain the: