
Question 1
Below is a partial regression output table showing the relationship between a team's point differential and its winning percentage.(Point differential is defined as the difference between the average number of points a team scores per game and the average number of points per game scored against that team.)
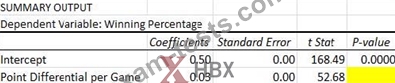
Assuming a significance level of 0.01, which of the following p-values would indicate a significant relationship between the two variables?
Assuming a significance level of 0.01, which of the following p-values would indicate a significant relationship between the two variables?
Question 2
A group of season ticket holders wants to forecast attendance at National Football League (NFL) games for the upcoming season. One ticket holder argues that using the population of the United States as the only independent variable would explain as much as using both the United States population and the percent change in disposable income (per capita) as independent variables. Another ticket holder argues that using the percent change in disposable income (per capita) asthe only independent variable would provide the most accurate forecast. Listed below are the Adjusted R2 values for three regression models. Based on these values, and keeping in mind that the ticket holders are only concerned about forecasting, what is the correct conclusion?
- NFL Attendance vs. US Population and Percent Change in Disposable Income.
Adjusted R2= 0.8964 - NFL Attendance vs. US Population: Adjusted R2= 0.8609 - NFL Attendance vs. Percent Change in Disposable Income. Adjusted R2= -0.0244
- NFL Attendance vs. US Population and Percent Change in Disposable Income.
Adjusted R2= 0.8964 - NFL Attendance vs. US Population: Adjusted R2= 0.8609 - NFL Attendance vs. Percent Change in Disposable Income. Adjusted R2= -0.0244
Question 3
A company collected $10,000 from a customer in payment for goods sold to the customer a month ago on credit. How would the collection impact the accounting equation?
Question 4
A professional football team is considering adding two more games to its season. Which of the following costs should team owners NOT consider when making this decision?
Question 5
In finance, beta is a measure of the systematic risk of a security in comparison to the market as a whole. Beta can be found by running a regression analysis of the monthly returns of the security versus the monthly returns of the general market. The regression output table below shows the relationship between Boeing's monthly returns and the monthly returns of the Standard and Poor's 500 (S&P 500) which is a stock market index of 500 large companies.
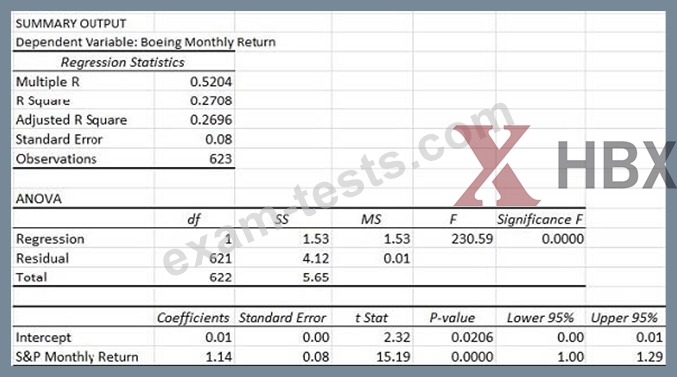
If beta is the average change in Boeing's monthly returns as the monthly returns of the S&P 500 increase by one, what is Boeing's beta?
If beta is the average change in Boeing's monthly returns as the monthly returns of the S&P 500 increase by one, what is Boeing's beta?