
Question 26
The following fault tree diagram was developed by a team.
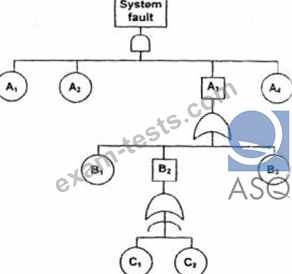
The probability are as follow:
A1 = 0.90 B1 = 0.90 C1 = 0.80
A2 = 0.80 B3 = 0.80 C2 = 0.70
A4 = 0.70
The likelihood that the system fault will occur is
Response:
The probability are as follow:
A1 = 0.90 B1 = 0.90 C1 = 0.80
A2 = 0.80 B3 = 0.80 C2 = 0.70
A4 = 0.70
The likelihood that the system fault will occur is
Response:
Question 27
Your company has just installed a new computer data entry system and you must determine the new input error rates. Management requires you to report the error rate within 0.5%, at a 95% confidence level.
What sample size do you need if the population standard deviation is 1.2%?
Response:
What sample size do you need if the population standard deviation is 1.2%?
Response:
Question 28
Basic sources of reliability data are:
I. In-plant testing.
II. Field testing.
III. Operation by user.
Response:
I. In-plant testing.
II. Field testing.
III. Operation by user.
Response:
Question 29
Total system effectiveness can be predicted during the conceptual or development design by considering three main elements of reliability. Which of the four elements does NOT apply?
Response:
Response:
Question 30
The reliability growth factor is MOST important to consider in which of the following situation?
Response:
Response: