Question 16
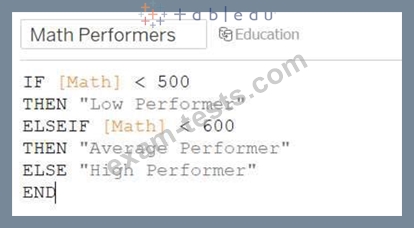
Connect to the "Education" data source. Analyze the Math score and create 3 categories. If the score is less than 500 then consider the student as 'Low Performer'. If the score is greater than or equal to 500 but less than
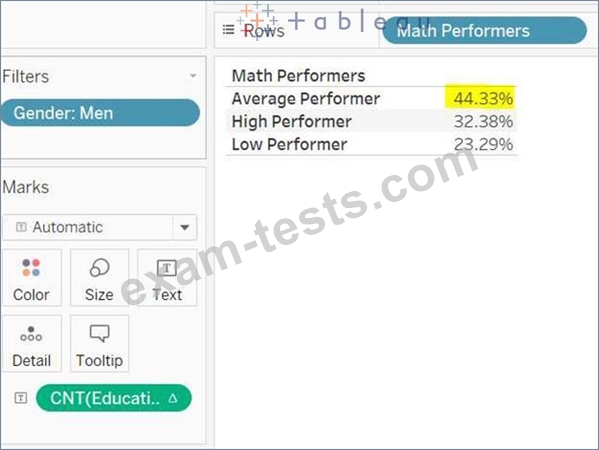
600 then call it 'Average Performer'. If the score is greater than or equal to 600 then 'High Performer'. Find out the percentage of Average Performers in males?
600 then call it 'Average Performer'. If the score is greater than or equal to 600 then 'High Performer'. Find out the percentage of Average Performers in males?
Question 17
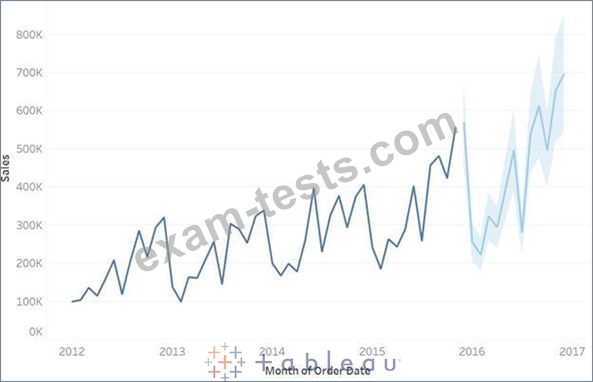
In Forecast, what is the shaded region?
Question 18
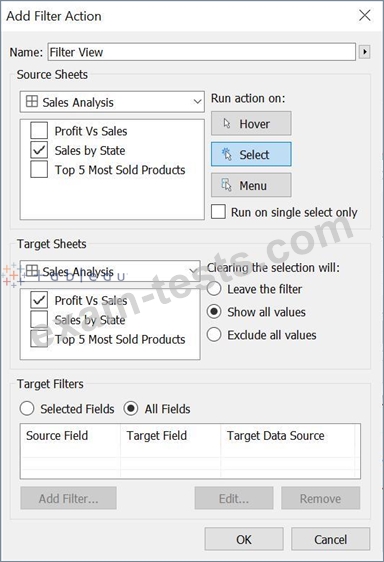
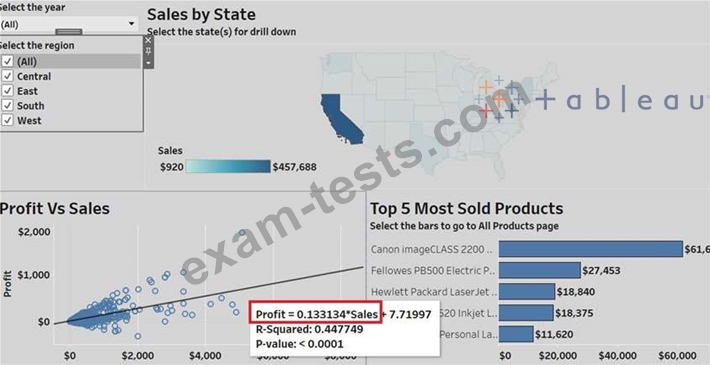
Using the Sales Analysis Dashboard, create a filter action that will trigger once you select any state in Sales by State View, and it should update the Profit Vs Sales view. Find out using trend lines in the Profit Vs Sales view, how much does profit increase for each dollar of sales for the California state?
Question 19
Connect to the "Global Superstore" data source and use the Orders table. Create a view using Profit and Sales.
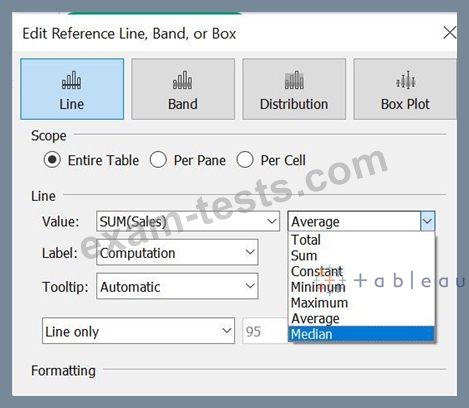
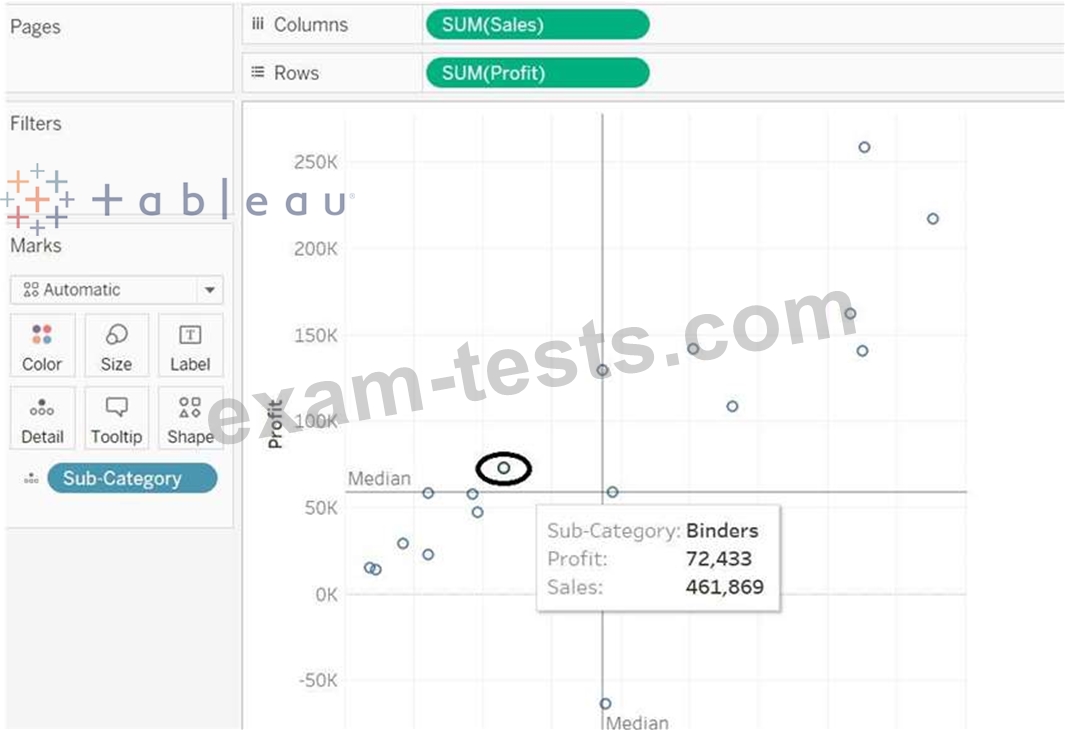
Find out which sub-category is above the profit median but below the sales median value?
Find out which sub-category is above the profit median but below the sales median value?
Question 20
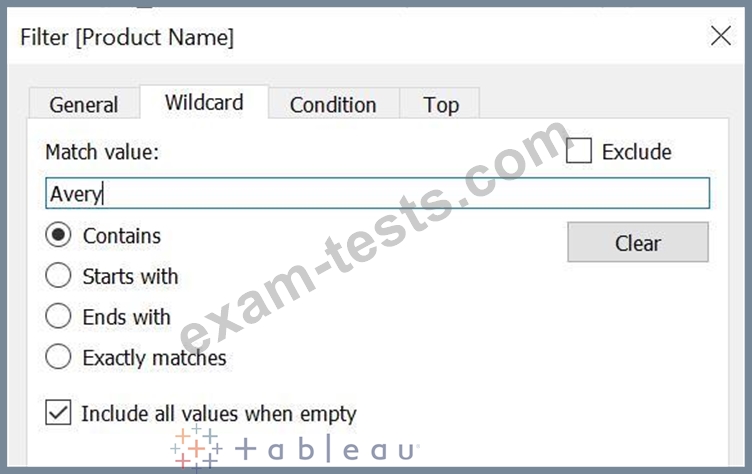
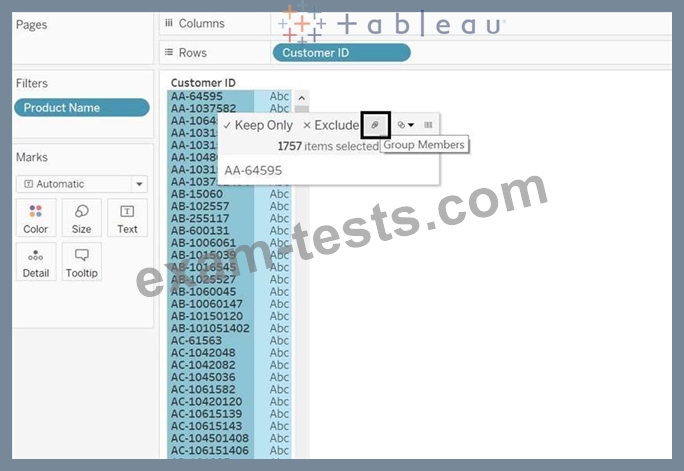
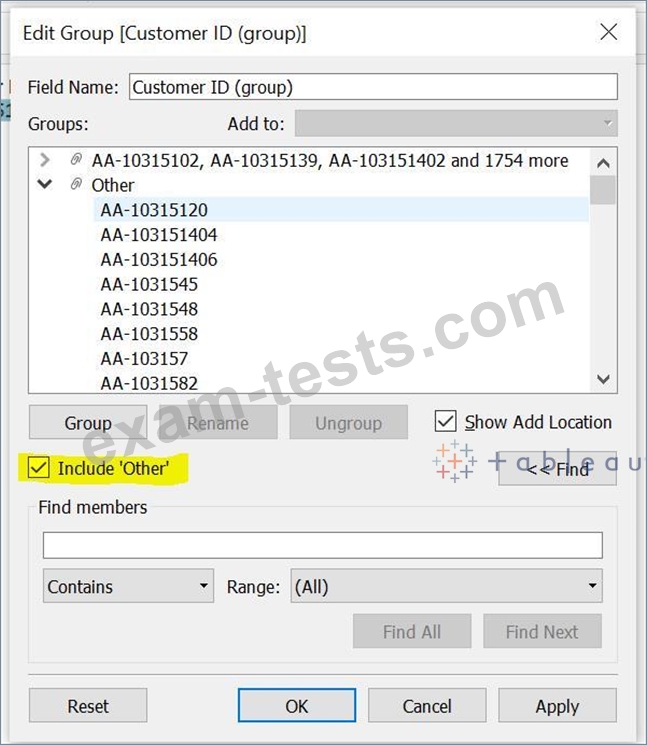
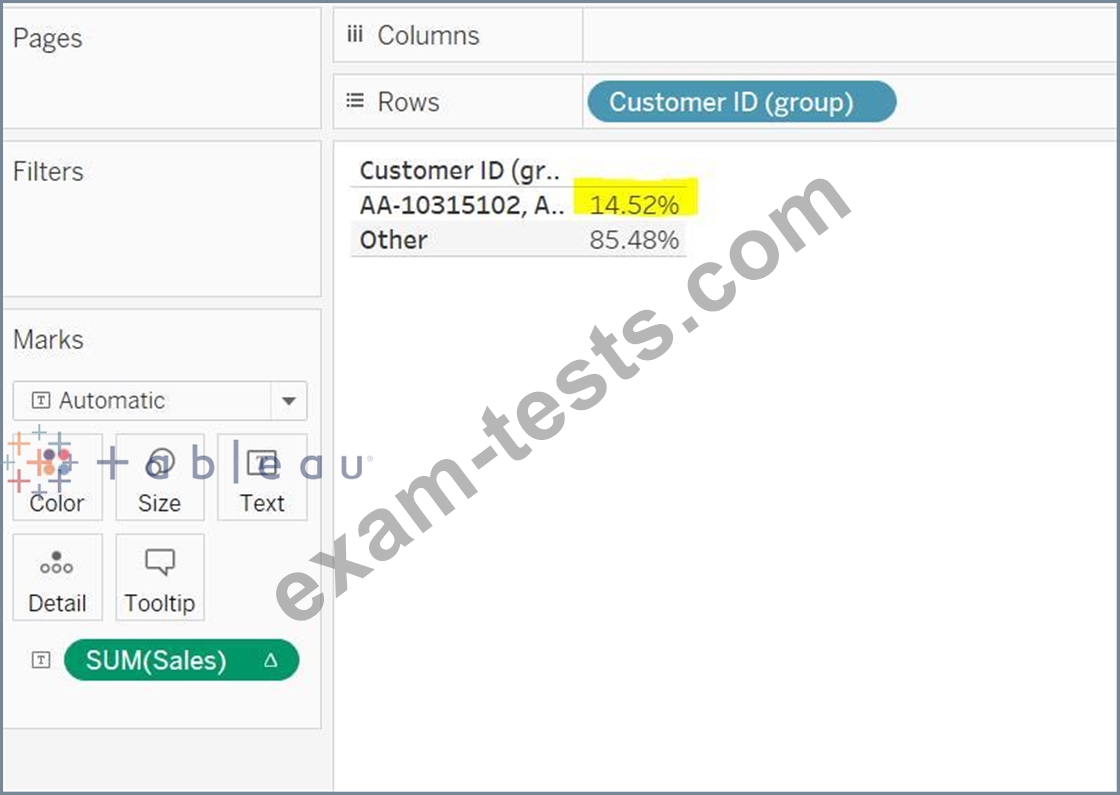
Connect to the "Global Superstore" data source and use the Orders table. Find out the percentage of total sales in all categories by customers who have purchased any product which contains the word 'Avery'?