
Question 6
Download the Dataset from:
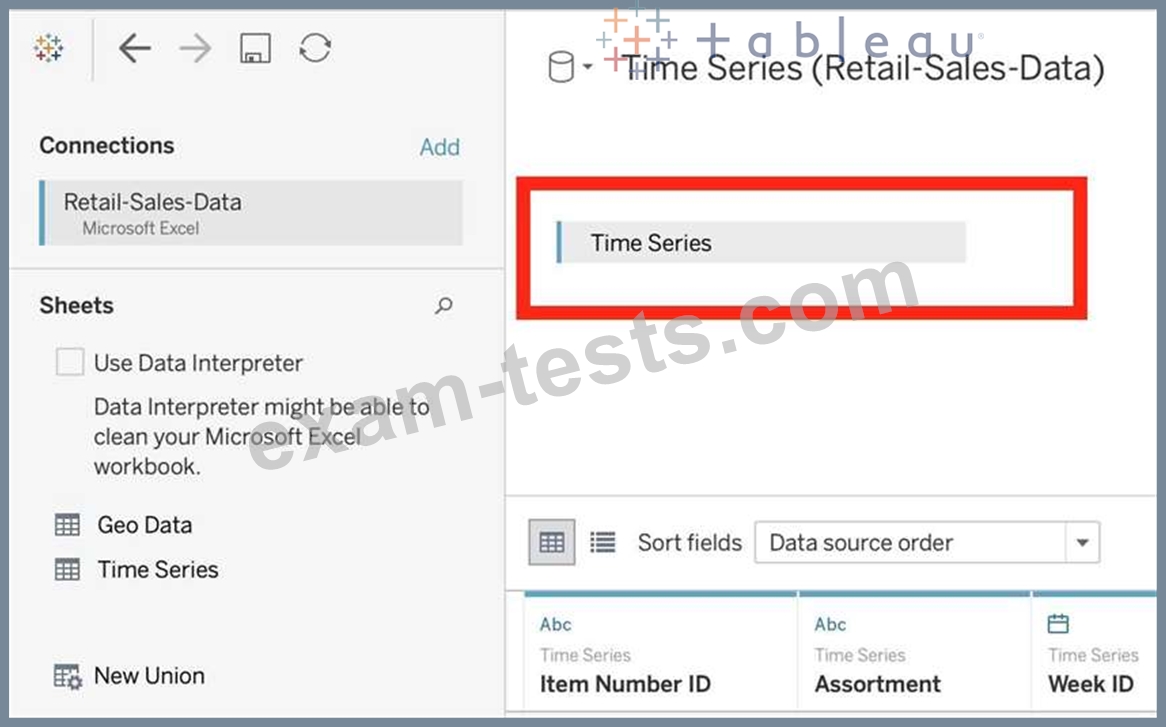
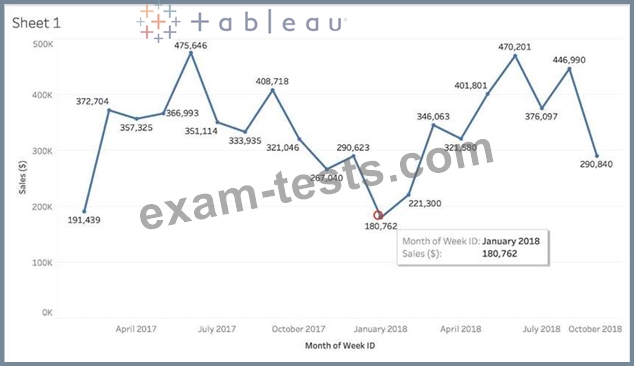
https://drive.google.com/file/d/12AYHfiPWkwBmvH0zbumOURgUX6Az00Rw/view?usp=sharing Using the Time Series Table, create a line chart to show Sales over time. Which Month and Year witnessed the lowest Sales?
https://drive.google.com/file/d/12AYHfiPWkwBmvH0zbumOURgUX6Az00Rw/view?usp=sharing Using the Time Series Table, create a line chart to show Sales over time. Which Month and Year witnessed the lowest Sales?
Question 7
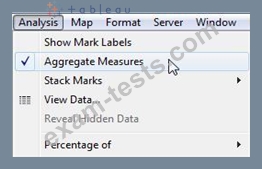
True or False: We can disaggregate the data, to see all of the marks in the view at the most detailed level of granularity
Question 8
________________ files are shortcuts for quickly connecting to the original data that you use often. Data source files do not contain the actual data but rather the information necessary to connect to the actual data as well as any modifications you've made on top of the actual data such as changing default properties, creating calculated fields, adding groups, and so on.
Question 9
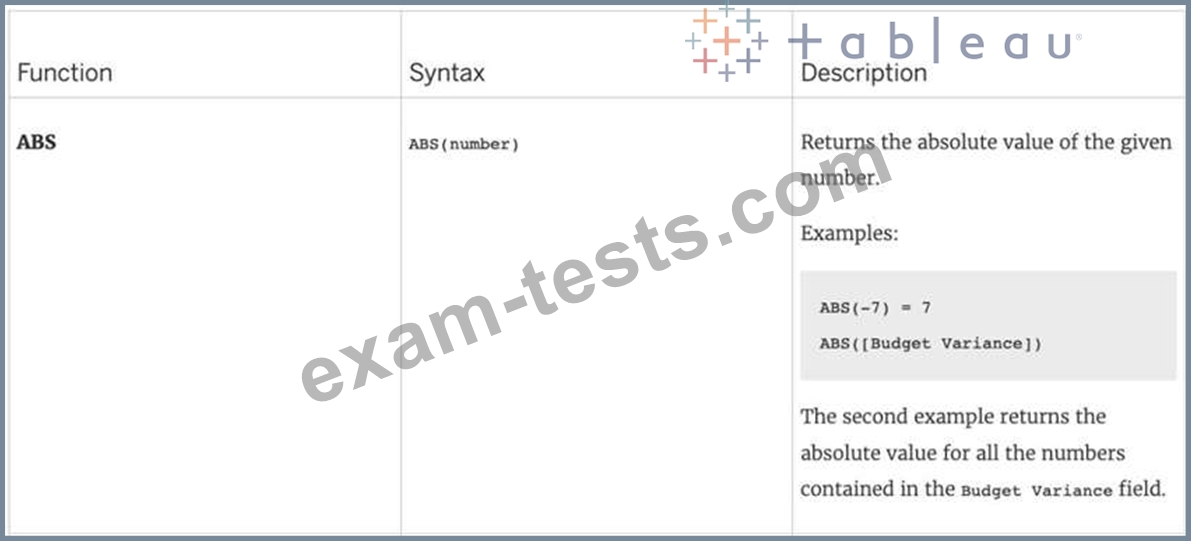
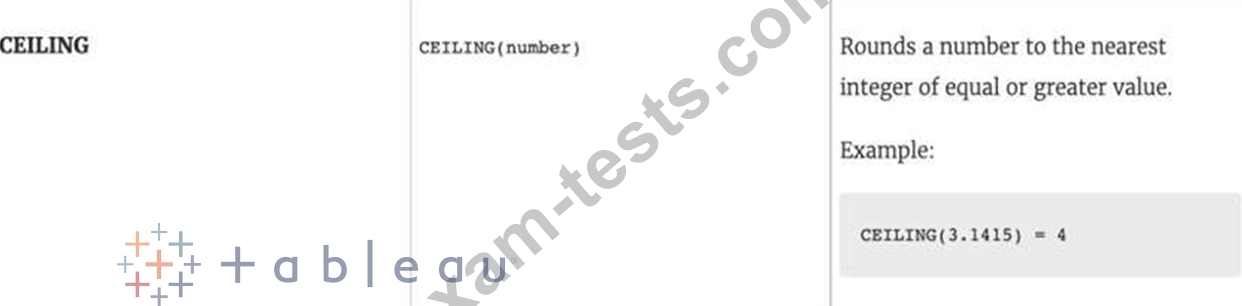
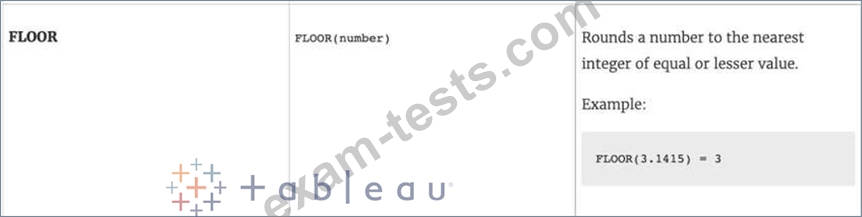
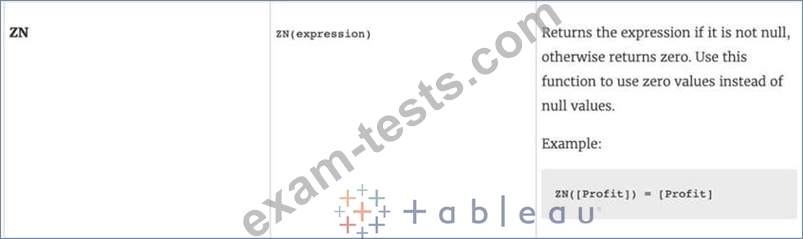
Which of the following returns the Absolute Value of a given number?
Question 10
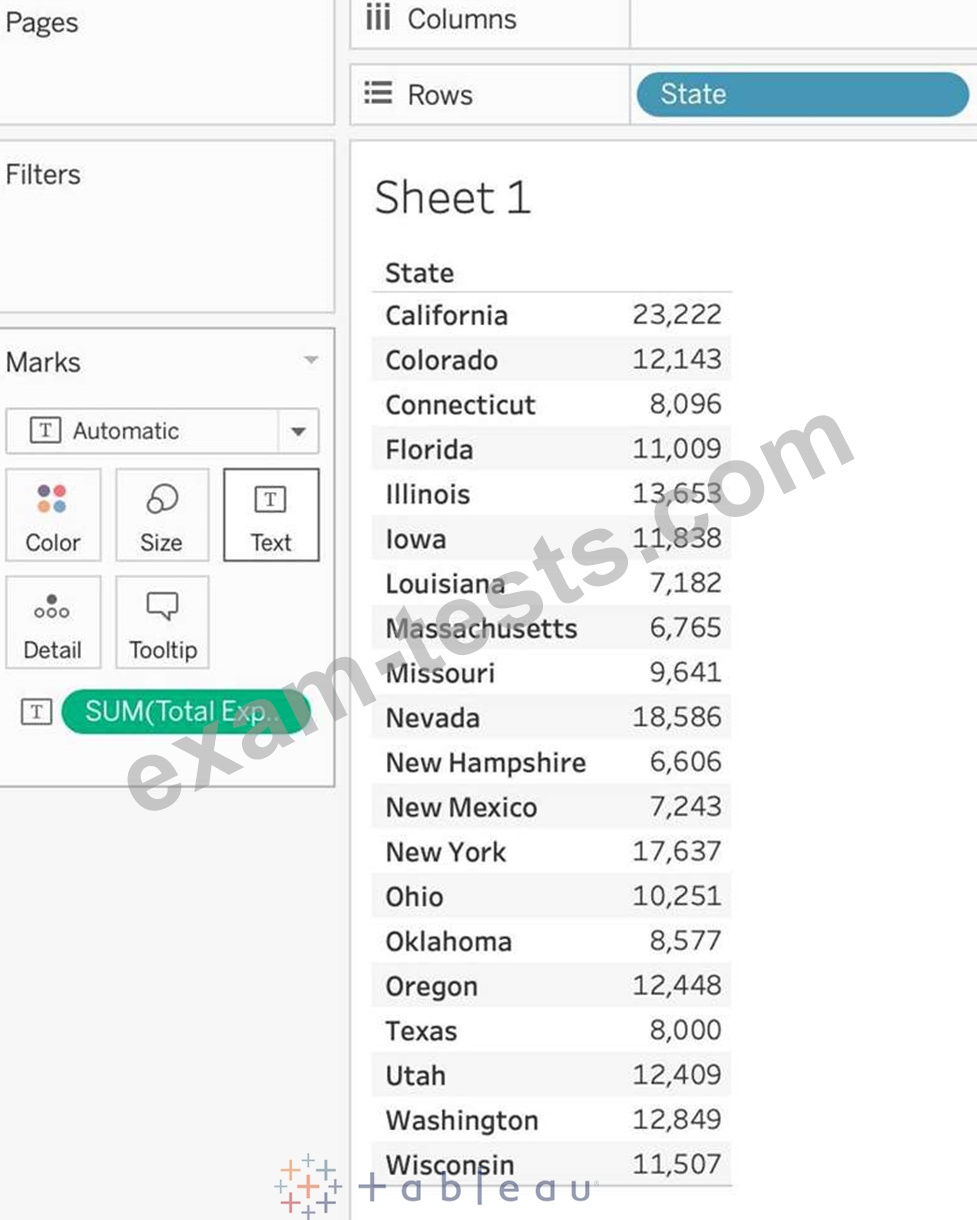
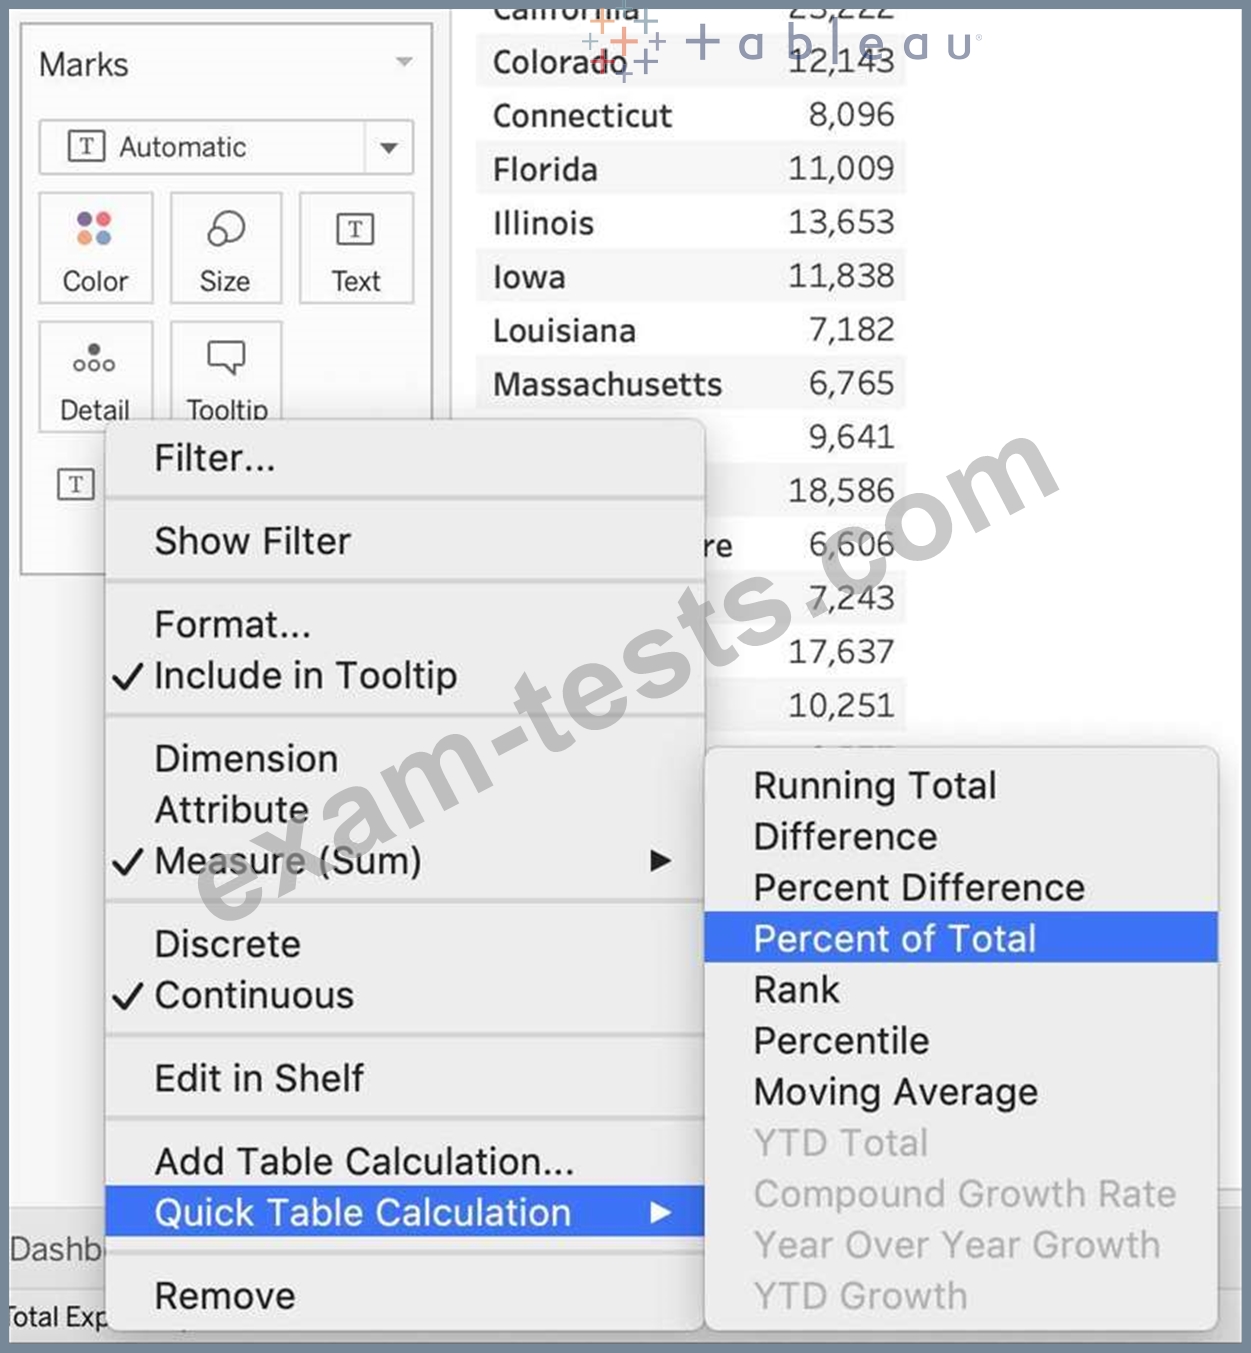
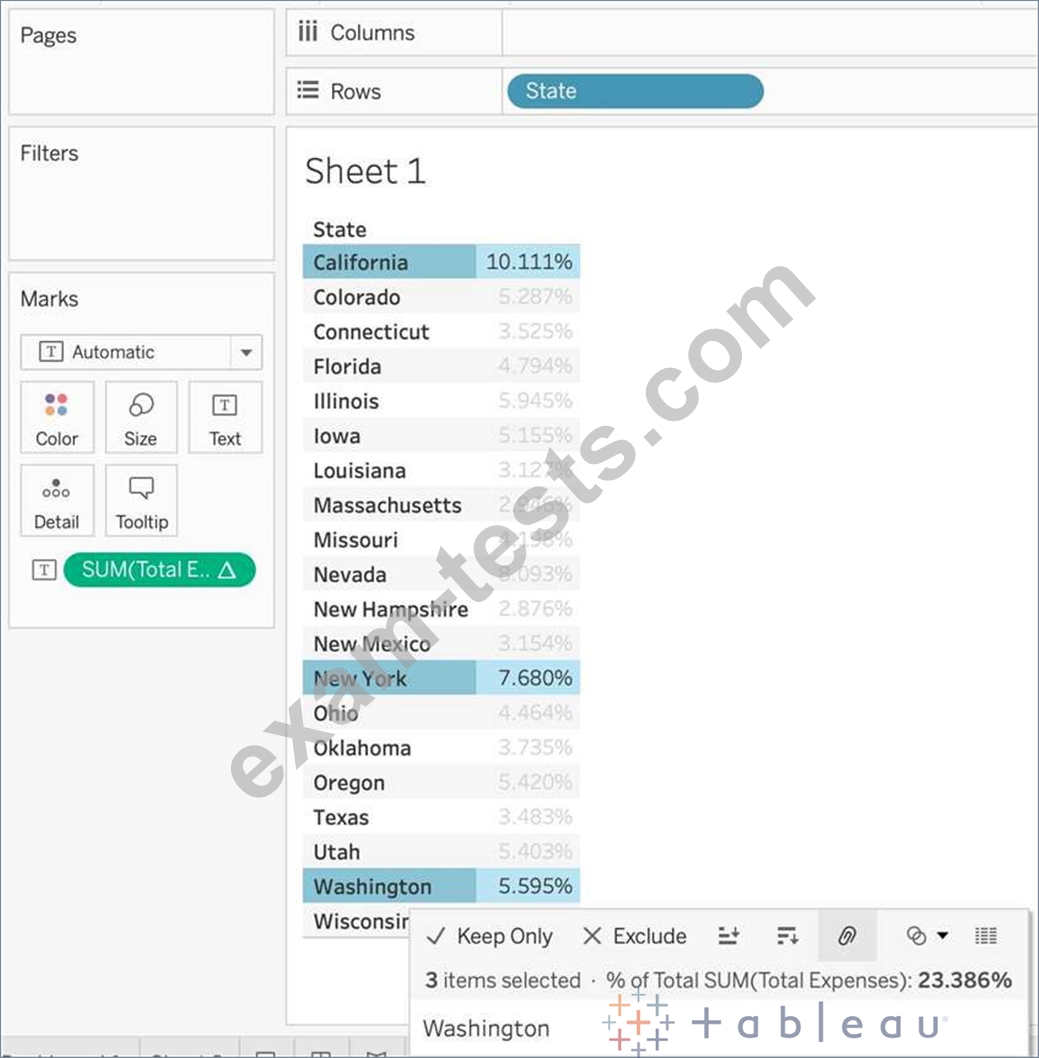
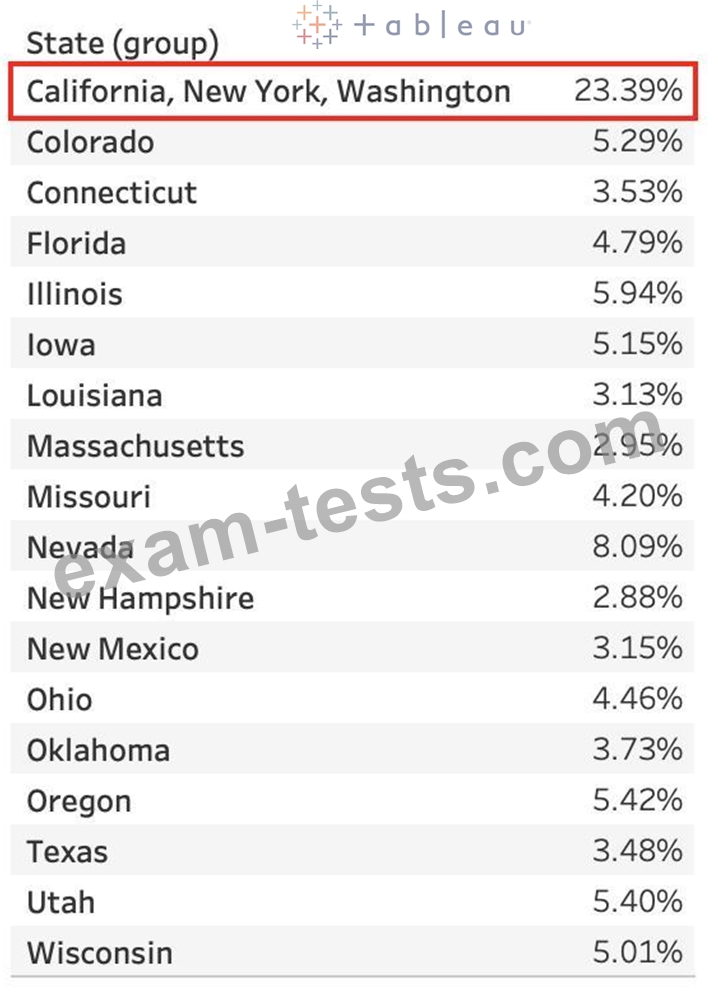
Using the CoffeeChain table, create a crosstab showing the Total Expenses per State and add Column Grand Totals to the view. Now group the states of New York, California and Washington. What percent of the total sales does this group contribute?
Premium Bundle
Newest Desktop-Specialist Exam PDF Dumps shared by BraindumpsPass.com for Helping Passing Desktop-Specialist Exam! BraindumpsPass.com now offer the updated Desktop-Specialist exam dumps, the BraindumpsPass.com Desktop-Specialist exam questions have been updated and answers have been corrected get the latest BraindumpsPass.com Desktop-Specialist pdf dumps with Exam Engine here: