
Question 6
An analyst needs to compare monthly sales, year over year, based on when an order was created, as shown in the exhibit.
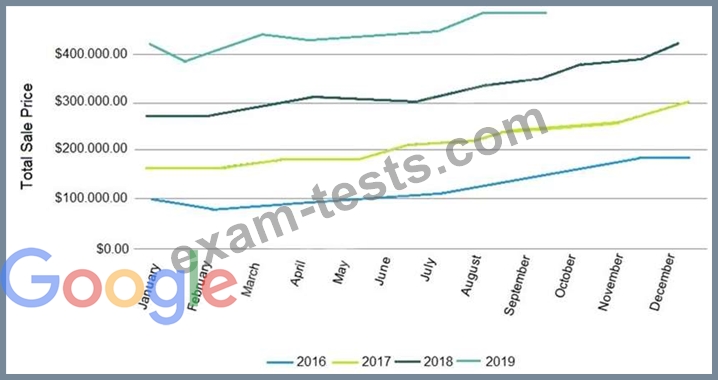
How should the analyst, in addition to selecting the measure Total Sales build the report?
How should the analyst, in addition to selecting the measure Total Sales build the report?
Question 7
An analyst is trying to rank companies in an Explore and visualize the rank as a column chart. The analyst selects the Brand Name dimension and the Rank dimension. They then select the column chart visualization type, but receive the error "Measure, time or numeric field required: Column graphs require at least one dimension or for the first dimension field to be of type: number or type: time".
How can the analyst resolve this error while showing the rank as a column visualization?
How can the analyst resolve this error while showing the rank as a column visualization?
Question 8
An analyst has created a line chart with Value Labels enabled, but the values are too long and need to be abbreviated.
Which visualization option should the analyst utilize to alter the display of the value labels?
Which visualization option should the analyst utilize to alter the display of the value labels?
Question 9
An analyst creates a column chart showing the count of total orders and the count of returned orders on each date. The number of returned orders is much smaller than the number of total orders, so the columns for the returned orders are short and it is difficult to compare all the columns visually.
How should the analyst ensure that the differences between returned order counts for each day are more visible?
How should the analyst ensure that the differences between returned order counts for each day are more visible?
Question 10
A company has an operational dashboard that needs to display the latest data every 5 minutes on a monitor.
How should the analyst configure the dashboard?
How should the analyst configure the dashboard?