
Question 61
You are creating an analytics report that will consume data from the tables shown in the following table.
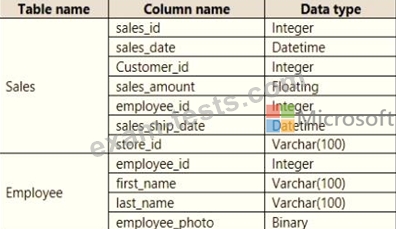
There is a relationship between the tables.
There are no reporting requirements on employeejd and employee_photo.
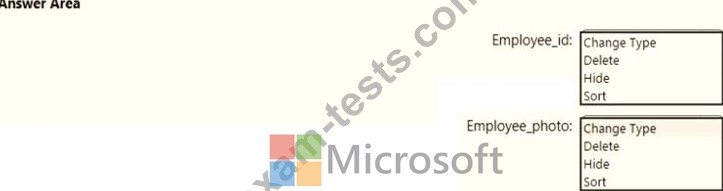
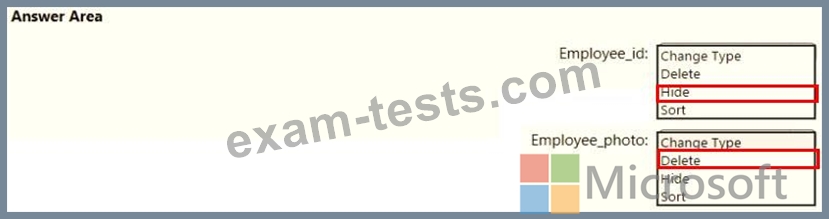
You need to optimize the data model
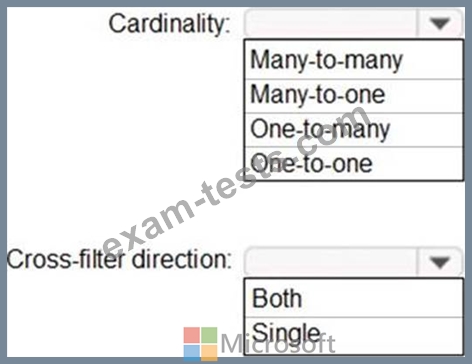
What should you configure for employeejd and employee.photo? To answer, select the appropriate options in the answer area.
There is a relationship between the tables.
There are no reporting requirements on employeejd and employee_photo.
You need to optimize the data model
What should you configure for employeejd and employee.photo? To answer, select the appropriate options in the answer area.
Question 62
DRAG DROP
You have a Microsoft Power BI data model that contains three tables named Sales, Product, and Date.
The Sales table has an existing measure named [Total Sales] that sums the total sales from the Sales table.
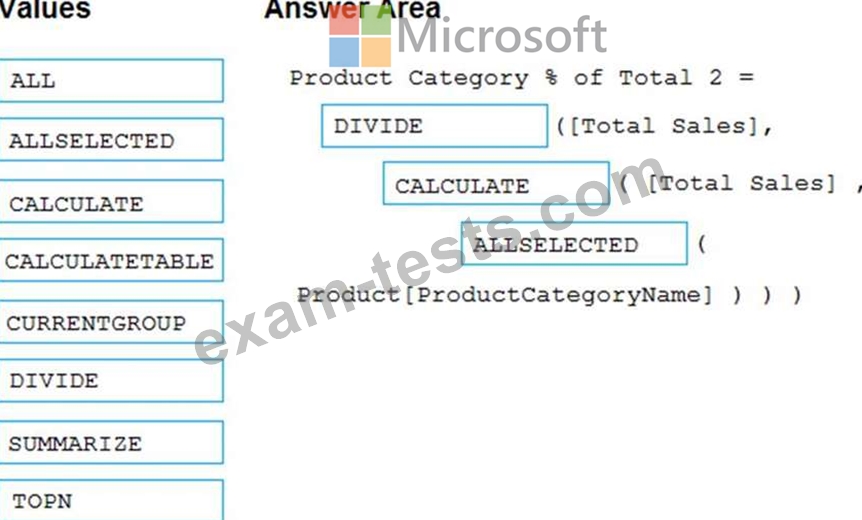
You need to write a calculation that returns the percentage of total sales that a selected ProductCategoryName value represents. The calculation must respect any slicers on ProductCategoryName and must show the percentage of visible total sales. For example, if there are four ProductCategoryName values, and a user filters one out, a table showing ProductCategoryName and the calculation must sum up to 100 percent.
How should you complete the calculation? To answer, drag the appropriate values to the correct targets. Each value may be used once, more than once, or not at all. You may need to drag the split bar between panes or scroll to view content. NOTE: Each correct selection is worth one point.

You have a Microsoft Power BI data model that contains three tables named Sales, Product, and Date.
The Sales table has an existing measure named [Total Sales] that sums the total sales from the Sales table.
You need to write a calculation that returns the percentage of total sales that a selected ProductCategoryName value represents. The calculation must respect any slicers on ProductCategoryName and must show the percentage of visible total sales. For example, if there are four ProductCategoryName values, and a user filters one out, a table showing ProductCategoryName and the calculation must sum up to 100 percent.
How should you complete the calculation? To answer, drag the appropriate values to the correct targets. Each value may be used once, more than once, or not at all. You may need to drag the split bar between panes or scroll to view content. NOTE: Each correct selection is worth one point.
Question 63
HOTSPOT
You have two tables named Customers and Invoice in a Power BI model.
The Customers table contains the following fields:
* CustomerID
* Customer City
* Customer State
* Customer Name
* Customer Address 1
* Customer Address 2
* Customer Postal Code
The Invoice table contains the following fields:
* Order ID
* Invoice ID
* Invoice Date
* Customer ID
* Total Amount
* Total Item Count
The Customers table is related to the Invoice table through the Customer ID columns. A customer can have many invoices within one month.
The Power BI model must provide the following information:
* The number of customers invoiced in each state last month
* The average invoice amount per customer in each postal code
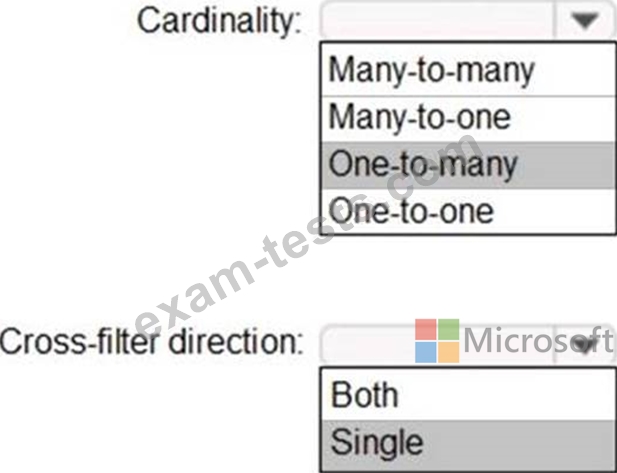
You need to define the relationship from the Customers table to the Invoice table. The solution must optimize query performance.
What should you configure? To answer, select the appropriate options in the answer area. NOTE: Each correct selection is worth one point.
You have two tables named Customers and Invoice in a Power BI model.
The Customers table contains the following fields:
* CustomerID
* Customer City
* Customer State
* Customer Name
* Customer Address 1
* Customer Address 2
* Customer Postal Code
The Invoice table contains the following fields:
* Order ID
* Invoice ID
* Invoice Date
* Customer ID
* Total Amount
* Total Item Count
The Customers table is related to the Invoice table through the Customer ID columns. A customer can have many invoices within one month.
The Power BI model must provide the following information:
* The number of customers invoiced in each state last month
* The average invoice amount per customer in each postal code
You need to define the relationship from the Customers table to the Invoice table. The solution must optimize query performance.
What should you configure? To answer, select the appropriate options in the answer area. NOTE: Each correct selection is worth one point.
Question 64
DRAG DROP
You have a Microsoft Power Bl workspace.
You need to grant the user capabilities shown in the following table.
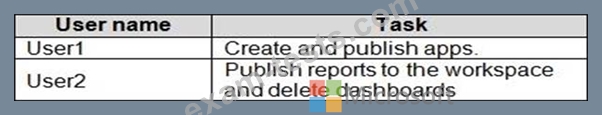
The solution must use the principle of least privilege.
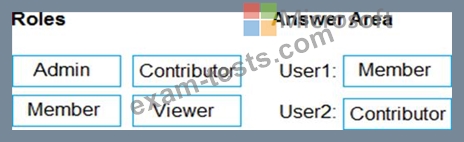
Which user role should you assign to each user? To answer, drag the appropriate roles to the correct users. Each role may be used once, more than once, or not at all. You may need to drag the split bar between panes or scroll to view content. NOTE: Each correct selection is worth one point.
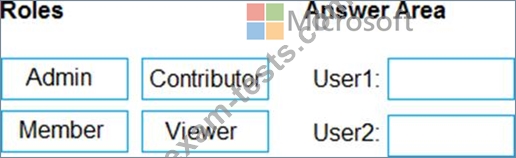
You have a Microsoft Power Bl workspace.
You need to grant the user capabilities shown in the following table.
The solution must use the principle of least privilege.
Which user role should you assign to each user? To answer, drag the appropriate roles to the correct users. Each role may be used once, more than once, or not at all. You may need to drag the split bar between panes or scroll to view content. NOTE: Each correct selection is worth one point.
Question 65
You have the dataset shown in the following exhibit.
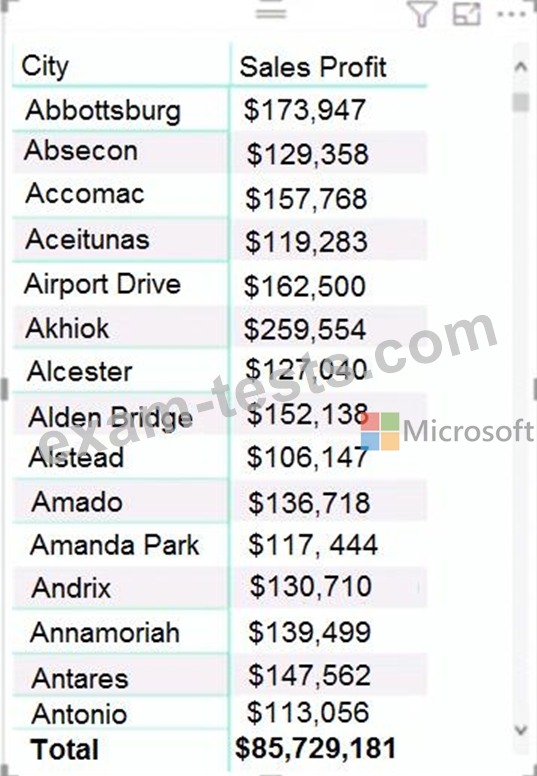
You need to ensure that the visual shows only the 10 cities that have the highest sales profit.
What should you do?
You need to ensure that the visual shows only the 10 cities that have the highest sales profit.
What should you do?
Premium Bundle
Newest PL-300 Exam PDF Dumps shared by BraindumpsPass.com for Helping Passing PL-300 Exam! BraindumpsPass.com now offer the updated PL-300 exam dumps, the BraindumpsPass.com PL-300 exam questions have been updated and answers have been corrected get the latest BraindumpsPass.com PL-300 pdf dumps with Exam Engine here: