

Question 26
You have a Microsoft Power Bl dashboard. The report used to create the dashboard uses an imported dataset from a Microsoft SQL Server data source.
The dashboard is shown in the exhibit. (Click the Exhibit tab.)

What occurred at 12:03:06 PM?
The dashboard is shown in the exhibit. (Click the Exhibit tab.)
What occurred at 12:03:06 PM?
Question 27
You need to create a DAX measure in the data model that only allows users to see projections at the appropriate levels of granularity.
How should you complete the measure? To answer, drag the appropriate values to the correct targets. Each value may be used once, more than once, or not at all. You may need to drag the split bar between panes or scroll to view content.
NOTE: Each correct selection is worth one point.

How should you complete the measure? To answer, drag the appropriate values to the correct targets. Each value may be used once, more than once, or not at all. You may need to drag the split bar between panes or scroll to view content.
NOTE: Each correct selection is worth one point.

Question 28
HOTSPOT
You have a dataset named Pens that contains the following columns:
* Unit Price
* Quantity Ordered
You need to create a visualization that shows the relationship between Unit Price and Quantity Ordered. The solution must highlight orders that have a similar unit price and ordered quantity.
Which type of visualization and which feature should you use? To answer, select the appropriate options in the answer area. NOTE: Each correct selection is worth one point.

You have a dataset named Pens that contains the following columns:
* Unit Price
* Quantity Ordered
You need to create a visualization that shows the relationship between Unit Price and Quantity Ordered. The solution must highlight orders that have a similar unit price and ordered quantity.
Which type of visualization and which feature should you use? To answer, select the appropriate options in the answer area. NOTE: Each correct selection is worth one point.

Question 29
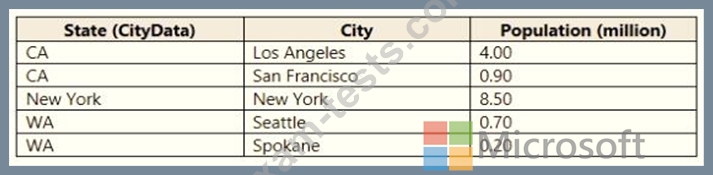
You are creating a Microsoft Power Bl model that has two tables named CityData and Sales. CityData contains only the data shown in the following table.
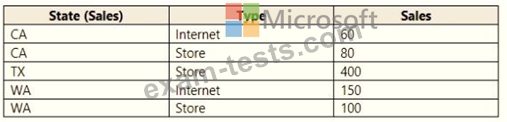
Sales contains only the data shown in the following table.
For each of the following statements, select Yes if the statement is true. Otherwise, select No.
NOTE: Each correct selection is worth one point.

Sales contains only the data shown in the following table.
For each of the following statements, select Yes if the statement is true. Otherwise, select No.
NOTE: Each correct selection is worth one point.

Question 30
You need to create a visualization that compares revenue and cost over time.
Which type of visualization should you use?
Which type of visualization should you use?