
Question 41
Note: This question is part of a series of questions that present the same scenario. Each question in the series contains a unique solution that might meet the stated goals. Some question sets might have more than one correct solution, while others might not have a correct solution.
After you answer a question in this section, you will NOT be able to return to it. As a result, these questions will not appear in the review screen.
You are modeling data by using Microsoft Power BI. Part of the data model is a large Microsoft SQL Server table named Order that has more than 100 million records.
During the development process, you need to import a sample of the data from the Order table.
Solution: You add a WHERE clause to the SQL statement.
Does this meet the goal?
Question 42
You have the following three versions of an Azure SQL database:
* Test
* Production
* Development
You have a dataset that uses the development database as a data source.
You need to configure the dataset so that you can easily change the data source between the development, test, and production database servers from powerbi.com.
Which should you do?
* Test
* Production
* Development
You have a dataset that uses the development database as a data source.
You need to configure the dataset so that you can easily change the data source between the development, test, and production database servers from powerbi.com.
Which should you do?
Question 43
What is the minimum number of datasets and storage modes required to support the reports?
Question 44
You are creating an analytics report that will consume data from the tables shown in the following table.
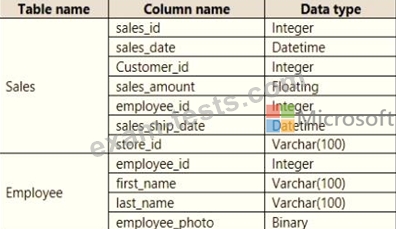
There is a relationship between the tables.
There are no reporting requirements on employeejd and employee_photo.
You need to optimize the data model
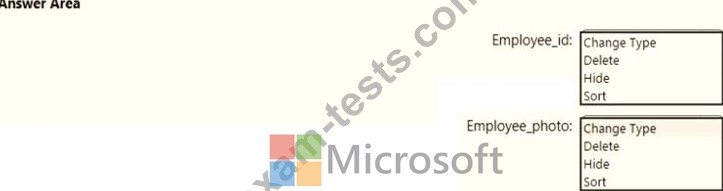
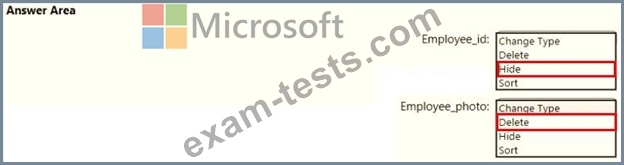
What should you configure for employeejd and employee.photo? To answer, select the appropriate options in the answer area.
There is a relationship between the tables.
There are no reporting requirements on employeejd and employee_photo.
You need to optimize the data model
What should you configure for employeejd and employee.photo? To answer, select the appropriate options in the answer area.
Question 45
Note: This question is part of a series of questions that present the same scenario. Each question in the series contains a unique solution that might meet the stated goals. Some question sets might have more than one correct solution, while others might not have a correct solution.
After you answer a question in this scenario, you will NOT be able to return to it. As a result, these questions will not appear in the review screen.
You have a clustered bar chart that contains a measure named Salary as the value and a field named Employee as the axis. Salary is present in the data as numerical amount representing US dollars.
You need to create a reference line to show which employees are above the median salary.
Solution: You create a median line by using the Salary measure.
Does this meet the goal?