
Question 91
ion have a Power BI dataset that contains a table named Temperature Readings. Temperature Readings contains the columns shown in the following table.

The table has 12 million rows. All the columns are needed for analysis.
You need to optimize the dataset to decrease the model size. The solution must not affect the precision of the data.
What should you do?
The table has 12 million rows. All the columns are needed for analysis.
You need to optimize the dataset to decrease the model size. The solution must not affect the precision of the data.
What should you do?
Question 92
Once the profit and loss dataset is created, which four actions should you perform in sequence to ensure that the business unit analysts see the appropriate profit and loss data? To answer, move the appropriate actions from the list of actions to the answer area and arrange them in the correct order.


Question 93
You have a dataset named Pens that contains the following columns:
Unit Price
Quantity Ordered
You need to create a visualization that shows the relationship between Unit Price and Quantity Ordered. The solution must highlight orders that have a similar unit price and ordered quantity.
Which type of visualization and which feature should you use? To answer, select the appropriate options in the answer area.
NOTE: Each correct selection is worth one point.

Question 94
HOTSPOT
You have a report page that contains the visuals shown in the following exhibit.

Use the drop-down menus to select the answer choice that completes each statement based on the information presented in the graphic. NOTE: Each correct selection is worth one point.

You have a report page that contains the visuals shown in the following exhibit.
Use the drop-down menus to select the answer choice that completes each statement based on the information presented in the graphic. NOTE: Each correct selection is worth one point.

Question 95
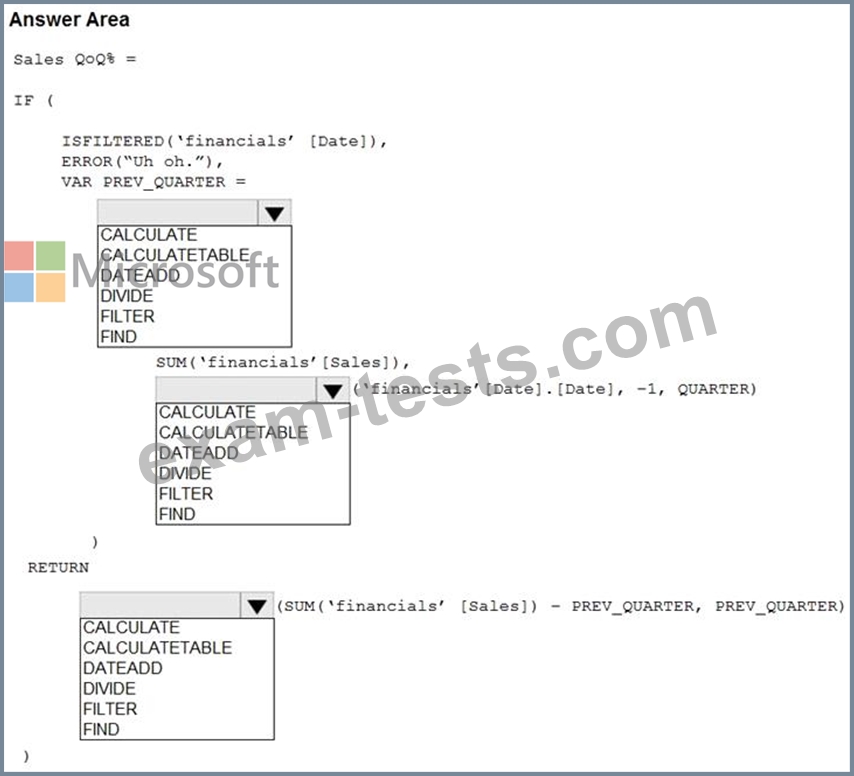
You are building a financial report by using Power BI.
You have a table named financials that contains a column named Date and a column named Sales.
You need to create a measure that calculates the relative change in sales as compared to the previous quarter.
How should you complete the measure? To answer, select the appropriate options in the answer area.
NOTE: Each correct selection is worth one point.
