
Question 86
You build a report about warehouse inventory dat
a. The dataset has more than 10 million product records from 200 warehouses worldwide. You have a table named Products that contains the columns shown in the following table.
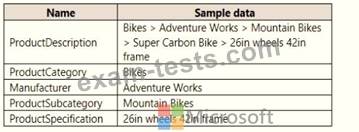
Warehouse managers report that it is difficult to use the report because the report uses only the product name in tables and visuals. The product name is contained within the ProductDescription column and is always the fourth value.
You need to modify the report to support the warehouse managers requirement to explore inventory levels at different levels of the product hierarchy. The solution must minimize the model size.
Which three actions should you perform in sequence? To answer, move the appropriate actions from the list of actions to the answer area and arrange them in the correct order.

a. The dataset has more than 10 million product records from 200 warehouses worldwide. You have a table named Products that contains the columns shown in the following table.
Warehouse managers report that it is difficult to use the report because the report uses only the product name in tables and visuals. The product name is contained within the ProductDescription column and is always the fourth value.
You need to modify the report to support the warehouse managers requirement to explore inventory levels at different levels of the product hierarchy. The solution must minimize the model size.
Which three actions should you perform in sequence? To answer, move the appropriate actions from the list of actions to the answer area and arrange them in the correct order.
Question 87
Note: This question is part of a series of questions that present the same scenario. Each question in the series contains a unique solution that might meet the stated goals. Some question sets might have more than one correct solution, while others might not have a correct solution.
After you answer a question in this scenario, you will NOT be able to return to it. As a result, these questions will not appear in the review screen.
You have a clustered bar chart that contains a measure named Salary as the value and a field named Employee as the axis. Salary is present in the data as numerical amount representing US dollars.
You need to create a reference line to show which employees are above the median salary.
Solution: You create an average line by using the Salary measure.
Does this meet the goal?
Question 88
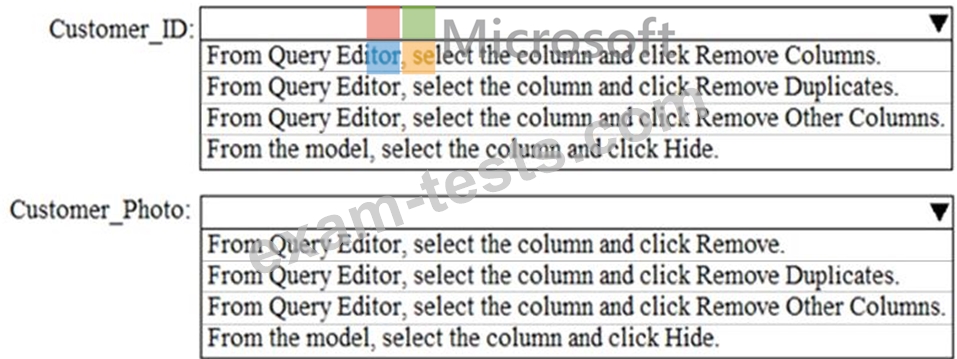
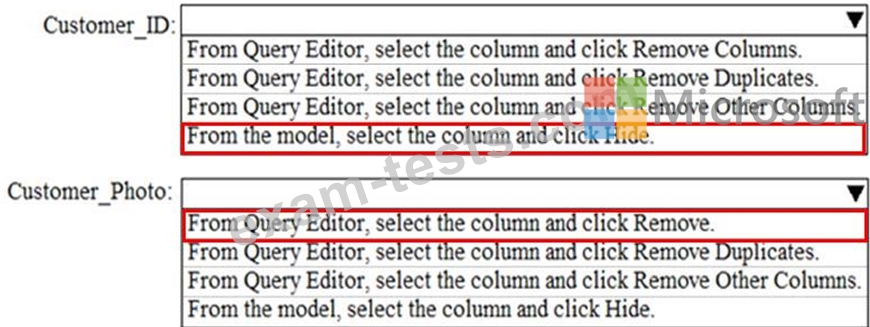
You are creating reports in Power BI Desktop. The model has the following tables.
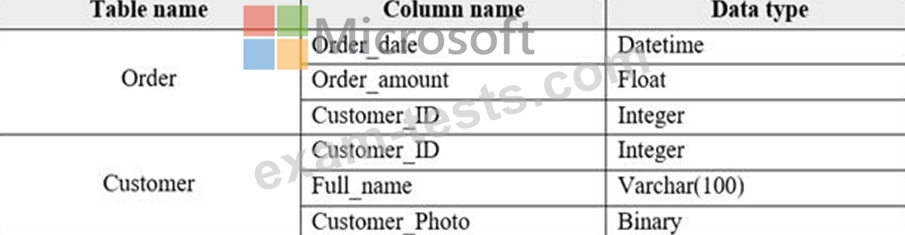
There is a relationship between the tables.
You plan to publish a report to the Power BI service that displays Order_amount by Order_date by Full_name.
You need to ensure that only the columns required for the report appear in Report View. The solution must minimize the size of the dataset that is published.
How should you configure the columns in Power BI Desktop? To answer, select the appropriate options in the answer area.
NOTE: Each correct selection is worth one point.
Question 89
You have a Power Bl workspace that contains a dataset. a report, and a dashboard. The following groups have access:
* External users can access the dashboard.
* Managers can access the dashboard and a manager-specific report.
* Employees can access the dashboard and a row-level security (RLS) constrained report.
You need all users, including the external users, to be able to tag workspace administrators if they identify an issue with the dashboard. The solution must ensure that other users see the issues that were raised.
What should you use?
Question 90
Your company has employees in 10 states.
The company recently decided to associate each state to one of the following three regions: East, West, and North.
You have a data model that contains employee information by state. The model does NOT include region information.
You have a report that shows the employees by state.
You need to view the employees by region as quickly as possible.
What should you do?