
Question 16
Note: This question is part of a series of questions that use the same scenario. For your convenience, the scenario is repeated in each question. Each question presents a different goal and answer choices, but the text of the scenario is the same in each question in this series.
You have a Microsoft SQL Server database that contains the following tables.
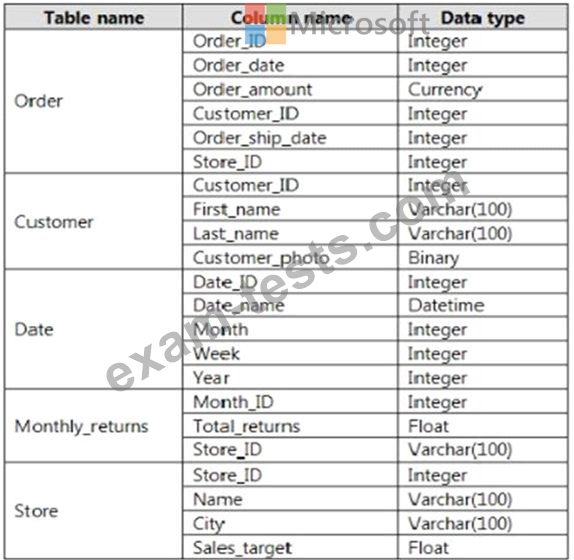
The following columns contain date information:
- Date[Month] in the mmyyyy format
- Date[Date_ID] in the ddmmyyyy format
- Date[Date_name] in the mm/dd/yyyy format
- Monthly_returns[Month_ID] in the mmyyyy format
The Order table contains more than one million rows.
The Store table has a relationship to the Monthly_returns table on the Store_ID column. This is the only relationship between the tables.
You plan to use Power BI Desktop to create an analytics solution for the data.
You need to create a relationship between the Order table and the Store table on the Store_ID column.
What should you do before you create the relationship?
You have a Microsoft SQL Server database that contains the following tables.
The following columns contain date information:
- Date[Month] in the mmyyyy format
- Date[Date_ID] in the ddmmyyyy format
- Date[Date_name] in the mm/dd/yyyy format
- Monthly_returns[Month_ID] in the mmyyyy format
The Order table contains more than one million rows.
The Store table has a relationship to the Monthly_returns table on the Store_ID column. This is the only relationship between the tables.
You plan to use Power BI Desktop to create an analytics solution for the data.
You need to create a relationship between the Order table and the Store table on the Store_ID column.
What should you do before you create the relationship?
Question 17
You import a Power Bl dataset that contains the following tables:
* Date
* Product
* Product Inventory
The Product inventory table contains 25 million rows. A sample of the data is shown in the following table.
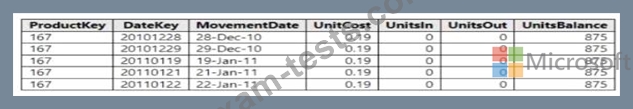
The Product Inventory table relates to the Date table by using the DateKey column. The Product inventory table relates to the Product table by using the ProductKey column. You need to reduce the size of the data model without losing information. What should you do?
* Date
* Product
* Product Inventory
The Product inventory table contains 25 million rows. A sample of the data is shown in the following table.
The Product Inventory table relates to the Date table by using the DateKey column. The Product inventory table relates to the Product table by using the ProductKey column. You need to reduce the size of the data model without losing information. What should you do?
Question 18
You have a table that contains sales data and approximately 1,000 rows.
You need to identify outliers in the table. Which type of visualization should you use?
You need to identify outliers in the table. Which type of visualization should you use?
Question 19
You have a Power BI dashboard that monitors the quality of manufacturing processes. The dashboard contains the following elements:
A line chart that shows the number of defective products manufactured by day.
A KPI visual that shows the current daily percentage of defective products manufactured.
You need to be notified when the daily percentage of defective products manufactured exceeds 3%.
What should you create?
A line chart that shows the number of defective products manufactured by day.
A KPI visual that shows the current daily percentage of defective products manufactured.
You need to be notified when the daily percentage of defective products manufactured exceeds 3%.
What should you create?
Question 20
Note: This question is a part of a series of questions that present the same scenario. For your convenience, the scenario is repeated in each question. Each question presents a different goal and answer choices, but the text of the scenario is exactly the same in each question in this series.
Start of repeated scenario
You have a Microsoft SQL Server database that has the tables shown in the Database Diagram exhibit. (Click the Exhibit.)
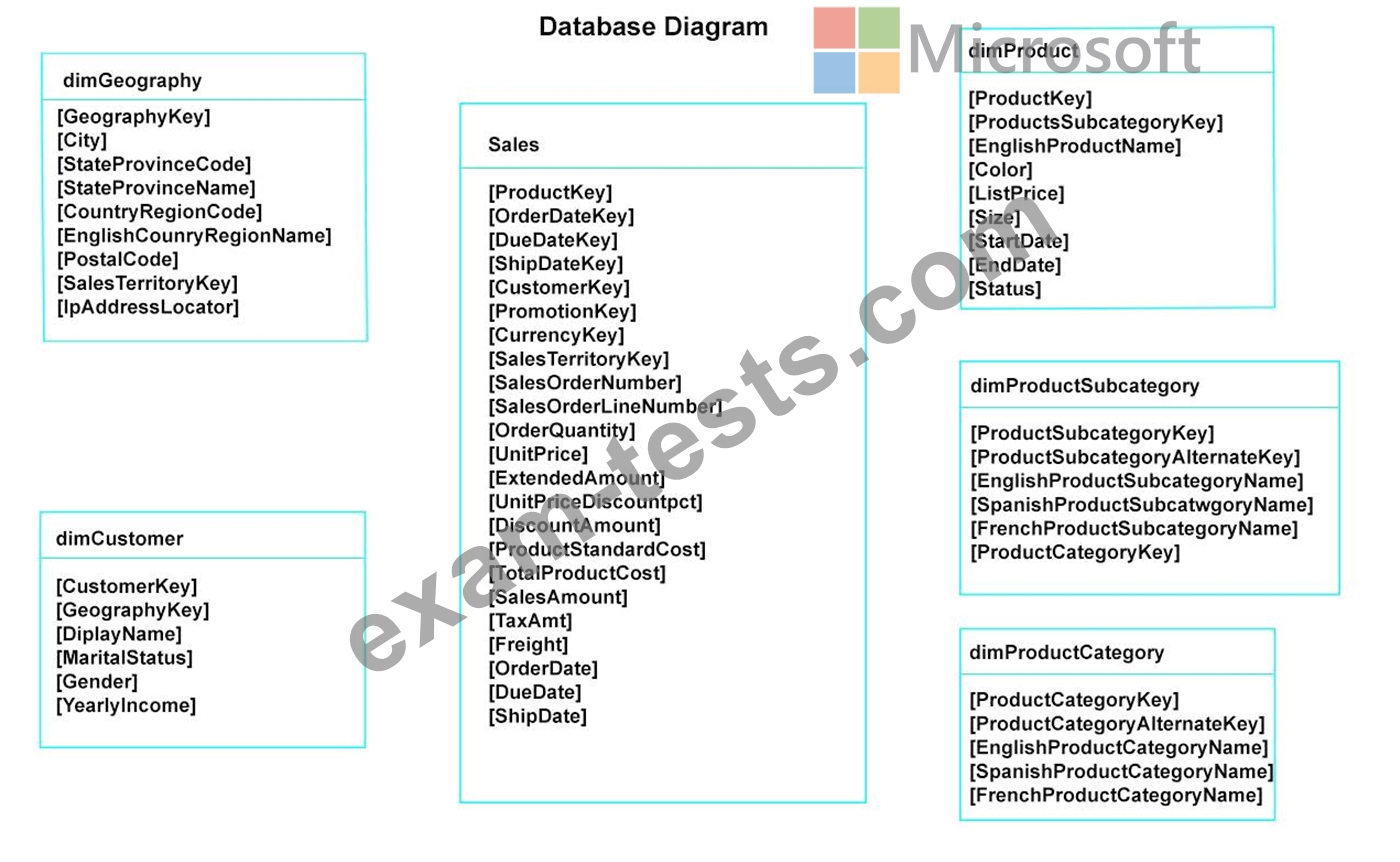
You plan to develop a Power BI model as shown in the Power BI Model exhibit. (Click the Exhibit).

You plan to use Power BI to import data from 2013 to 2015.
Product Subcategory [Subcategory] contains NULL values.
End of repeated scenario.
You implement the Power BI model.
You need to add a measure to rank total sales by product. The results must appear as shown in the following table.

Which DAX formula should you use?
Start of repeated scenario
You have a Microsoft SQL Server database that has the tables shown in the Database Diagram exhibit. (Click the Exhibit.)
You plan to develop a Power BI model as shown in the Power BI Model exhibit. (Click the Exhibit).
You plan to use Power BI to import data from 2013 to 2015.
Product Subcategory [Subcategory] contains NULL values.
End of repeated scenario.
You implement the Power BI model.
You need to add a measure to rank total sales by product. The results must appear as shown in the following table.
Which DAX formula should you use?
Premium Bundle
Newest PL-300 Exam PDF Dumps shared by BraindumpsPass.com for Helping Passing PL-300 Exam! BraindumpsPass.com now offer the updated PL-300 exam dumps, the BraindumpsPass.com PL-300 exam questions have been updated and answers have been corrected get the latest BraindumpsPass.com PL-300 pdf dumps with Exam Engine here: