
Question 111
You have a Microsoft Exert spreadsheet named Excel1 that contains survey results.
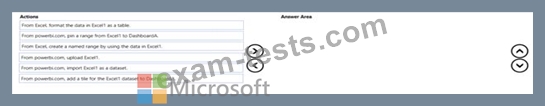
You have a Power Bl dashboard named DashboardA that has Q&A enabled.
You need to ensure that users who can access DashboardA can ask Questions based on the contents of Excel 1 and pm visuals based on their queries to Dashboard Which three actions should you perform in sequence? To answer, move the appropriate actions from the list of actions to the answer area and arrange them in the correct order.

Question 112
You have a dataset that contains revenue data from the past year.
You need to use anomaly detection in Power Bl to show anomalies in the dataset.
What should you configure? To answer, select the appropriate options in the answer area.
NOTE: Each correct selection is worth one point.

You need to use anomaly detection in Power Bl to show anomalies in the dataset.
What should you configure? To answer, select the appropriate options in the answer area.
NOTE: Each correct selection is worth one point.

Question 113
You are profiling data by using Power Query Editor.
The AddressLine2 column in a table named Address is shown in the following exhibit.

Use the drop-down menus to select the answer choice that completes each statement based on the information presented in the graphic.
NOTE: Each correct selection is worth one point.

The AddressLine2 column in a table named Address is shown in the following exhibit.
Use the drop-down menus to select the answer choice that completes each statement based on the information presented in the graphic.
NOTE: Each correct selection is worth one point.

Question 114
You plan to create the chart shown in the following exhibit.

How should you create the dashed horizontal line denoting the 40th percentile of daily sales for the period shown?
How should you create the dashed horizontal line denoting the 40th percentile of daily sales for the period shown?


Question 115
You are building a Power Bl report that uses data from an Azure SQL database named erp1.
You Import the following tables.

You need to perform the following analyses:
* Orders sold over time that include a measure of the total order value
* Orders by attributes of products sold
The solution must minimize update times when interacting with visuals in the report. What should you do first?
You Import the following tables.
You need to perform the following analyses:
* Orders sold over time that include a measure of the total order value
* Orders by attributes of products sold
The solution must minimize update times when interacting with visuals in the report. What should you do first?