
Question 156
You have a Power Bl report that contains a table visual with a measure named Revenue. The Revenue measure returns values within a range of 0 to S. You need to formal the visual so that the Revenue column displays a specific background color based on the value range shown in the following table.

Which three actions should you perform in sequence in Power B) Desktop? To answer, move the appropriate actions from the list of actions to the answer area and arrange them in the correct order.

Which three actions should you perform in sequence in Power B) Desktop? To answer, move the appropriate actions from the list of actions to the answer area and arrange them in the correct order.


Question 157
You are modeling data in table named SalesDetail by using Microsoft Power Bl.
You need to provide end users with access to the summary statistics about the SalesDetail data. The users require insights on the completeness of the data and the value distributions.
Which three actions should you perform in sequence? To answer, move the appropriate actions from the list of actions to the answer area and arrange them in the correct order.


Question 158
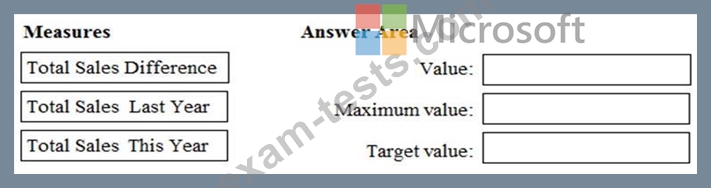
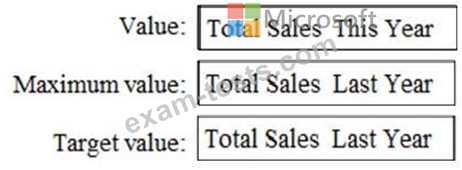
You have a Power BI model that contains a table named Sales. Sales has the following three measures:
* A measure named Total Sales Last Year that displays the sales from the previous calendar year. The current value is 32.89 million.
* A measure named Total Sales This Year that displays the sales from the current calendar year. The current value is 11.69 million.
* A measure named Total Sales Difference that uses a DAX formula of Sales[Last Year] - Sales[This Year].
You need to create the following visualization.

How should you configure the visualization? To answer, drag the appropriate measures to the correct fields.
Each value may be used once, more than once, or not at all. You may need to drag the split bar between panes or scroll to view content.
NOTE: Each correct selection is worth one point.
* A measure named Total Sales Last Year that displays the sales from the previous calendar year. The current value is 32.89 million.
* A measure named Total Sales This Year that displays the sales from the current calendar year. The current value is 11.69 million.
* A measure named Total Sales Difference that uses a DAX formula of Sales[Last Year] - Sales[This Year].
You need to create the following visualization.
How should you configure the visualization? To answer, drag the appropriate measures to the correct fields.
Each value may be used once, more than once, or not at all. You may need to drag the split bar between panes or scroll to view content.
NOTE: Each correct selection is worth one point.
Question 159
You have an Azure SQL database that contains sales transactions. The database is updated frequently.
You need to generate reports from the data to detect fraudulent transactions. The data must be visible within five minutes of an update.
How should you configure the data connection?
You need to generate reports from the data to detect fraudulent transactions. The data must be visible within five minutes of an update.
How should you configure the data connection?
Question 160
You are configuring a Power BI report for accessibility as shown in the following table.

You need to change the default colors of all three visuals to make the report more accessible to users who have color vision deficiency.
Which two settings should you configure in the Customize theme window? Each correct answer presents part of the solution.
NOTE: Each correct selection is worth one point.