Question 91
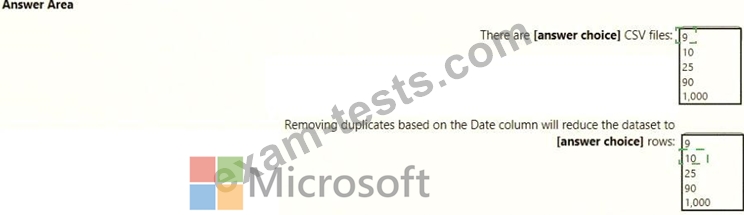
You view a query named Transactions as shown in the following exhibit.
The query gets CSV files from a folder.
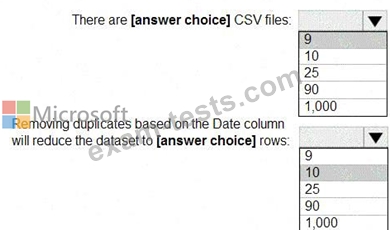
Use the drop-down menus to select the answer choice that completes each statement based on the information presented in the graphic.
NOTE: Each correct selection is worth one point.
The query gets CSV files from a folder.
Use the drop-down menus to select the answer choice that completes each statement based on the information presented in the graphic.
NOTE: Each correct selection is worth one point.
Question 92
You have a Power BI model that has the following tables:
Product (Product_id, Product_Name)
Sales (Order_id, Order_Date, Product_id, Salesperson_id, Sales_Amount)
Salesperson (Salesperson_id, Salesperson_name, address)
You plan to create the following measure.
Measure1 = DISTINCTCOUNT(Sales[ProductID])
You need to create the following relationships:
Sales to Product
Sales to Salesperson
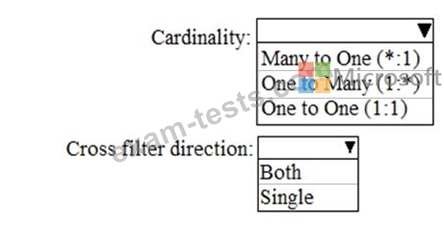
The solution must ensure that you can use Measure1 to display the count of products sold by each salesperson.
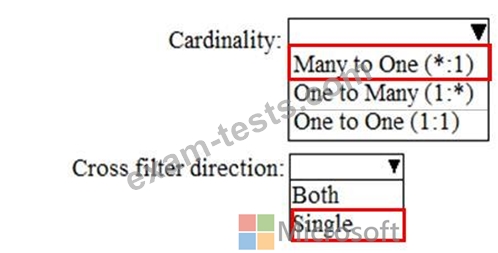
How should you configure the relationships? To answer, select the appropriate options in the answer area.
NOTE: Each correct selection is worth one point.
Product (Product_id, Product_Name)
Sales (Order_id, Order_Date, Product_id, Salesperson_id, Sales_Amount)
Salesperson (Salesperson_id, Salesperson_name, address)
You plan to create the following measure.
Measure1 = DISTINCTCOUNT(Sales[ProductID])
You need to create the following relationships:
Sales to Product
Sales to Salesperson
The solution must ensure that you can use Measure1 to display the count of products sold by each salesperson.
How should you configure the relationships? To answer, select the appropriate options in the answer area.
NOTE: Each correct selection is worth one point.
Question 93
You have a report that contains three pages. One of the pages contains a KPI visualization. You need to filter all the visualizations in the report except for the KPI visualization. Which two actions should you perform?
Each correct answer presents part of the solution. NOTE: Each correct selection is worth one point.
Each correct answer presents part of the solution. NOTE: Each correct selection is worth one point.
Question 94
Note: This question is part of a series of questions that present the same scenario. Each question in the series contains a unique solution that might meet the stated goals. Some question sets might have more than one correct solution, while others might not have a correct solution.
After you answer a question in this scenario, you will NOT be able to return to it. As a result, these questions will not appear in the review screen.
You have a clustered bar chart that contains a measure named Salary as the value and a field named Employee as the axis. Salary is present in the data as numerical amount representing US dollars.
You need to create a reference line to show which employees are above the median salary.
Solution: You create an average line by using the Salary measure.
Does this meet the goal?
After you answer a question in this scenario, you will NOT be able to return to it. As a result, these questions will not appear in the review screen.
You have a clustered bar chart that contains a measure named Salary as the value and a field named Employee as the axis. Salary is present in the data as numerical amount representing US dollars.
You need to create a reference line to show which employees are above the median salary.
Solution: You create an average line by using the Salary measure.
Does this meet the goal?
Question 95
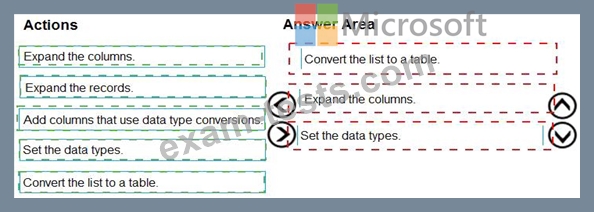
You are building a dataset from a JSON file that contains an array of documents.
You need to import attributes as columns from all the documents in the JSON file. The solution must ensure that date attributes can be used as date hierarchies in Microsoft Power BI reports.
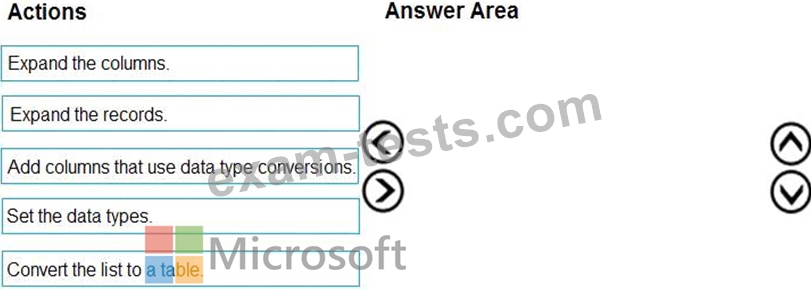
Which three actions should you perform in sequence? To answer, move the appropriate actions from the list of actions to the answer area and arrange them in the correct order.
You need to import attributes as columns from all the documents in the JSON file. The solution must ensure that date attributes can be used as date hierarchies in Microsoft Power BI reports.
Which three actions should you perform in sequence? To answer, move the appropriate actions from the list of actions to the answer area and arrange them in the correct order.