
Question 186
You have a line chart that shows the number of employees in a department over time.
You need to see the total salary costs of the employees when you hover over a data point.
What is possible way to achieve this goal?
You need to see the total salary costs of the employees when you hover over a data point.
What is possible way to achieve this goal?
Question 187
You need to design the data model and the relationships for the Customer Details worksheet and the Orders table by using Power BI. The solution must meet the report requirements.
For each of the following statement, select Yes if the statement is true, Otherwise, select No.
NOTE: Each correct selection is worth one point.

For each of the following statement, select Yes if the statement is true, Otherwise, select No.
NOTE: Each correct selection is worth one point.

Question 188
You need to create a visualization to meet the reporting requirements of the sales managers.
How should you create the visualization? To answer, select the appropriate options in the answer area.
NOTE: Each correct selection is worth one point.

How should you create the visualization? To answer, select the appropriate options in the answer area.
NOTE: Each correct selection is worth one point.


Question 189
You are creating a column chart visualization.
You configure groups as shown in the Groups exhibit. {Click the Groups tab.)

The visualization appears as shown in the Chart exhibit. (Click the Chart tab.)
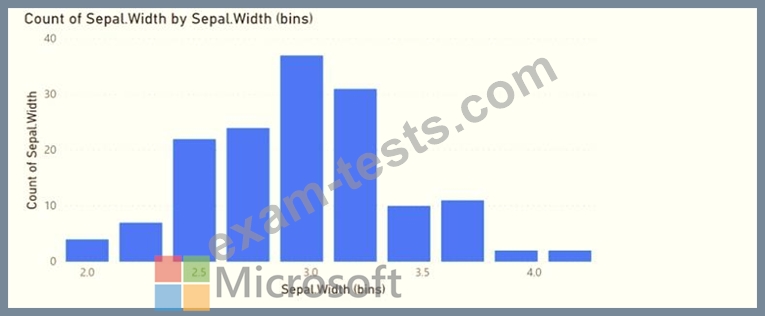
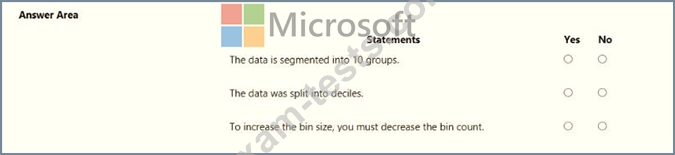
For each of the following statements, select Yes if the statement is true. Otherwise, select No.
NOTE: Each correct selection is worth one point.
You configure groups as shown in the Groups exhibit. {Click the Groups tab.)
The visualization appears as shown in the Chart exhibit. (Click the Chart tab.)
For each of the following statements, select Yes if the statement is true. Otherwise, select No.
NOTE: Each correct selection is worth one point.

Question 190
You have a Power Bl report for the marketing department. The report reports on web traffic to a blog and contains data from the following tables.

There is a one-to-many relationship from Posts to Traffic that uses the URL and URL Visited columns. The report contains the visuals shown in the following table.

The dataset takes a long time to refresh.
You need to modify Posts and Traffic queries to reduce toad times.
Which two actions will reduce the toad times? Each correct answer presents part of the solution.
NOTE: Each correct selection is worth one point.
There is a one-to-many relationship from Posts to Traffic that uses the URL and URL Visited columns. The report contains the visuals shown in the following table.
The dataset takes a long time to refresh.
You need to modify Posts and Traffic queries to reduce toad times.
Which two actions will reduce the toad times? Each correct answer presents part of the solution.
NOTE: Each correct selection is worth one point.