
Question 361
Note: This question is a part of a series of questions that present the same scenario. For your convenience, the scenario is repeated in each question. Each question presents a different goal and answer choices, but the text of the scenario is exactly the same in each question in this series.
Start of repeated scenario
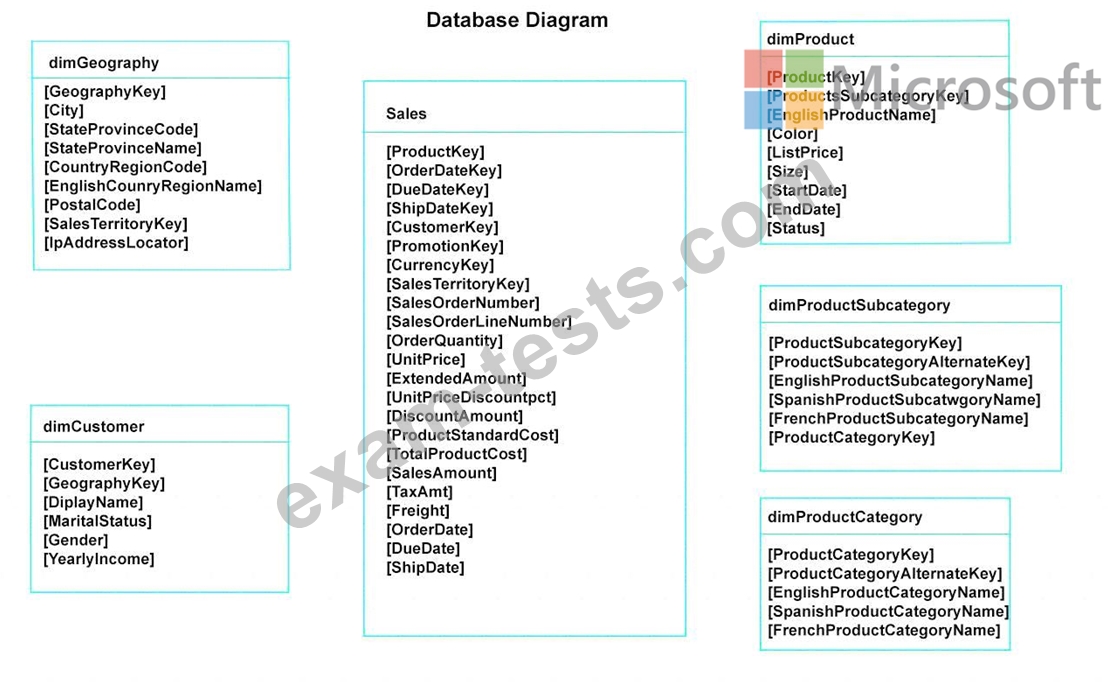
You have a Microsoft SQL Server database that has the tables shown in the Database Diagram exhibit. (Click the Exhibit.)
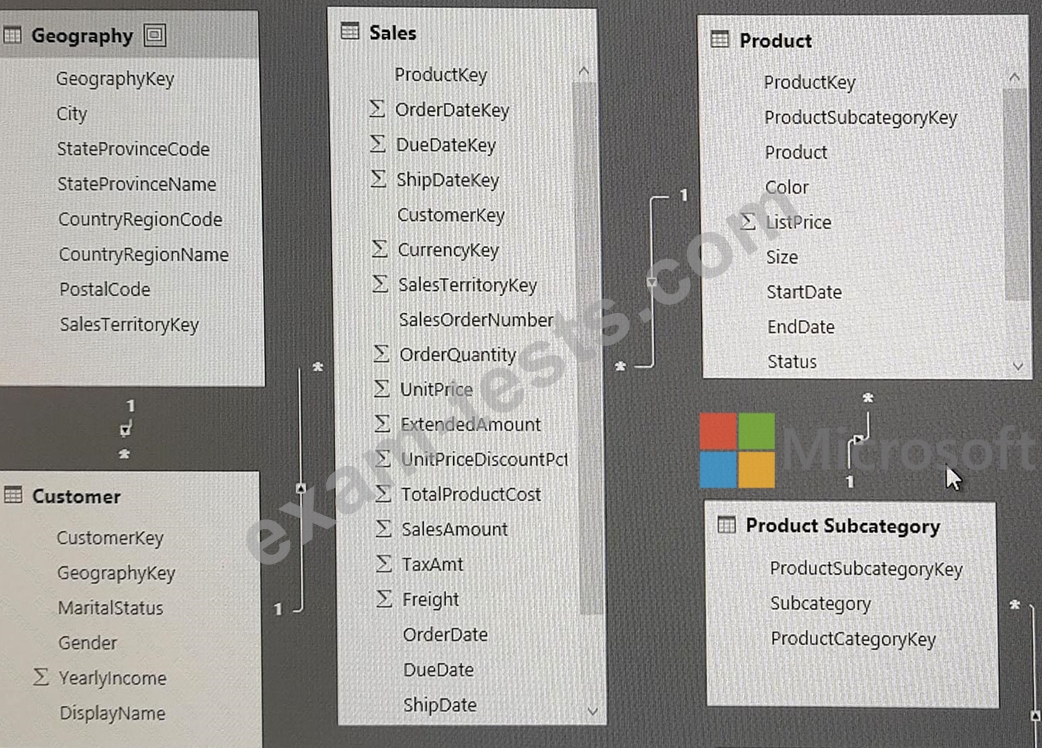
You plan to develop a Power BI model as shown in the Power BI Model exhibit. (Click the Exhibit).
You plan to use Power BI to import data from 2013 to 2015.
Product Subcategory [Subcategory] contains NULL values.
End of repeated scenario.
You implement the Power BI model.
You need to add a new column to the Product Subcategory table that uses the following formula.
=if [Subcategory] =null then "NA" else [Subcategory]
Which command should you use in Query Editor?
Start of repeated scenario
You have a Microsoft SQL Server database that has the tables shown in the Database Diagram exhibit. (Click the Exhibit.)
You plan to develop a Power BI model as shown in the Power BI Model exhibit. (Click the Exhibit).
You plan to use Power BI to import data from 2013 to 2015.
Product Subcategory [Subcategory] contains NULL values.
End of repeated scenario.
You implement the Power BI model.
You need to add a new column to the Product Subcategory table that uses the following formula.
=if [Subcategory] =null then "NA" else [Subcategory]
Which command should you use in Query Editor?
Question 362
You are using the key influencers visual to identify which factors affect the quantity of items sold in an order.
You add the following fields to the Explain By field:
* Customer Country
* Product Category
* Supplier Country
* Sales Employee
* Supplier Name
* Product Name
* Customer City
The key influencers visual returns the results shown in the following exhibit.

What can you identify from the visual?
You add the following fields to the Explain By field:
* Customer Country
* Product Category
* Supplier Country
* Sales Employee
* Supplier Name
* Product Name
* Customer City
The key influencers visual returns the results shown in the following exhibit.
What can you identify from the visual?
Question 363
You have a Power 31 data model that contains a table named Stores. The table has the following columns:
* Store Name
* Open Date
* Status
* State
* City
You need to create a calculated column named Active Store Name that meets the following requirements
* Store Name
* Open Date
* Status
* State
* City
You need to create a calculated column named Active Store Name that meets the following requirements

Question 364
You create the following step by using Power Query Editor.
= Table.ReplaceValue(SalesLT_Address,"1318","1319",Replacer.ReplaceText,{"AddressLine1"}) A row has a value of 21318 Lasalle Street in the AddressLine1 column. What will the value be when the step is applied?
= Table.ReplaceValue(SalesLT_Address,"1318","1319",Replacer.ReplaceText,{"AddressLine1"}) A row has a value of 21318 Lasalle Street in the AddressLine1 column. What will the value be when the step is applied?

Question 365
You are modeling data in table named SalesDetail by using Microsoft Power Bl.
You need to provide end users with access to the summary statistics about the SalesDetail data. The users require insights on the completeness of the data and the value distributions.
Which three actions should you perform in sequence? To answer, move the appropriate actions from the list of actions to the answer area and arrange them in the correct order.

