
Question 11
The sales manager is investigating the relationship between Sales and Margin to determine if this relationship is linear when choosing the dimension Customer or Product Category The sales manager wants to have the potential percentage Sales tor each Stage (initial to Won) of the sales process What are the two correct visualizations?
Question 12
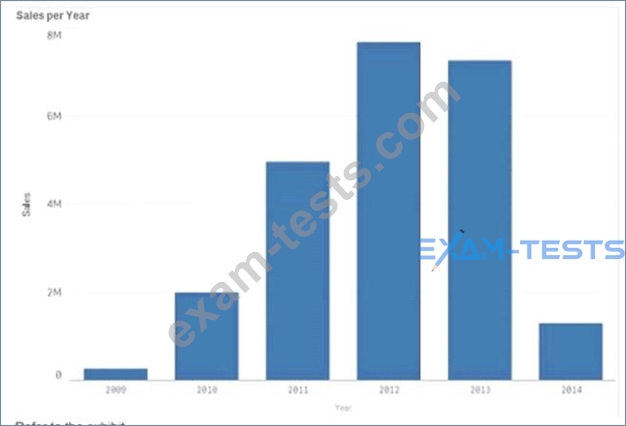
Refer to the exhibit.
A business analyst needs to display a bat chart only when less than 100 customers are selected What should the business analyst create to meet this requirement
A business analyst needs to display a bat chart only when less than 100 customers are selected What should the business analyst create to meet this requirement
Question 13
A business analyst is creating an app for technicians. The app must meet several requirements
* Visualization labels must change according to the selected tame period
* A button to toggle between Month and Year to Date (YTD)
* Two fields combine to create one dimension that is used m several visualizations Which three options are needed to meet the requirements? (Select three.)
* Visualization labels must change according to the selected tame period
* A button to toggle between Month and Year to Date (YTD)
* Two fields combine to create one dimension that is used m several visualizations Which three options are needed to meet the requirements? (Select three.)
Question 14
A business analyst is creating an app for the sales department
Users of the app most be able to create sheets and analyze data The sales department has several additional requirements
* Reuse the global sales visualization
* Create new visualizations
* The app has over 100 visualizations
Users will NOT have access to the full data model
What should be added to the master items to meet the requirement?
Question 15
A business analyst wants to create a dashboard for the Finance team to use The app must include four sheets one looking at the full dataset and three others focused on the regions APAC EMEA and AMERICAS each.
The team needs visualizations for
* Sales by Product in the past 6" months
* Cost of Sales on a map by Country
* Sales Cost and Margin by Month
Additionally the learn wants to dear fillers while navigating between sheets and enable chat in the hub Which features should be used?
The team needs visualizations for
* Sales by Product in the past 6" months
* Cost of Sales on a map by Country
* Sales Cost and Margin by Month
Additionally the learn wants to dear fillers while navigating between sheets and enable chat in the hub Which features should be used?