
Question 91
Open the link to Book1 found on the desktop. Open the sales dashboard.
Add the Sales by State sheet in a Show/Hide button to the right side of the dashboard.

Add the Sales by State sheet in a Show/Hide button to the right side of the dashboard.
Question 92
You have a data source that contains the following columns.

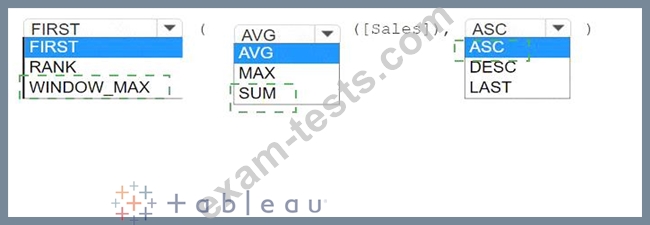
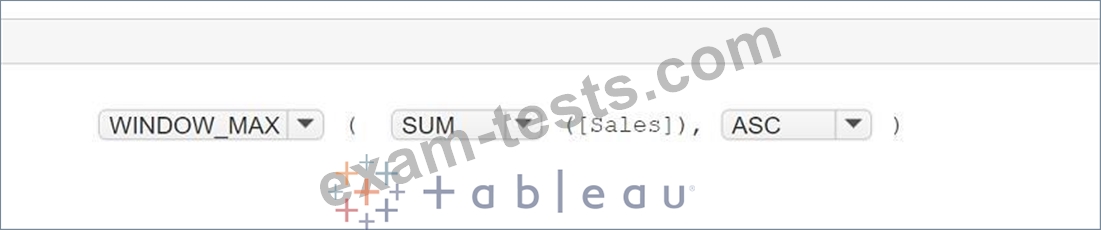
You want to sort customers based on the most expensive orders.
How should you complete the formula? (Use the dropdowns in the Answer Area to select the correct options to complete the formula.)
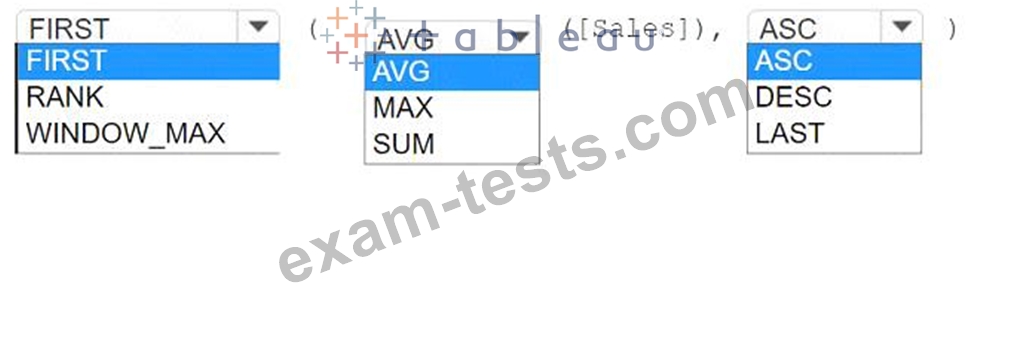
You want to sort customers based on the most expensive orders.
How should you complete the formula? (Use the dropdowns in the Answer Area to select the correct options to complete the formula.)
Question 93
You have the following dashboard.
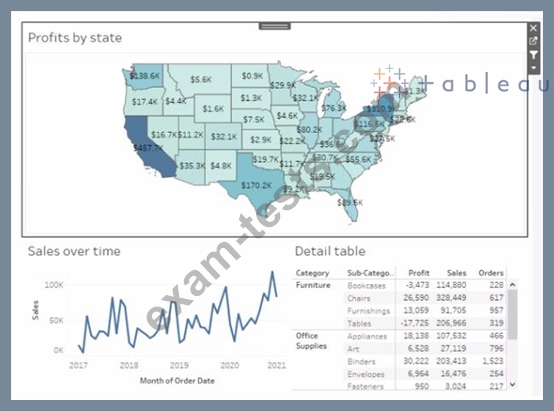
From the context menu of Sales over time, select Ignore Actions.
Several Lays later, you decide that you want to filter both Sales over time and Detail table by selecting a data point on the map.
What should you do?
From the context menu of Sales over time, select Ignore Actions.
Several Lays later, you decide that you want to filter both Sales over time and Detail table by selecting a data point on the map.
What should you do?
Question 94
Open the link to Book1 found on the desktop. Open SalesVSProfit worksheet.
Add a distribution band on Profit to show the standard deviation from- 1 to 1.
Add a distribution band on Profit to show the standard deviation from- 1 to 1.
Question 95
A Data Analyst has received a request to provide a dashboard related to employee time logs. The employees are entering their time using mobile devices throughout the day and data is stored in a cloud-based database.
The end users would like to receive data on their dashboard in as close to real-time as possible.
How should the analyst best create a data source to meet these requirements?
The end users would like to receive data on their dashboard in as close to real-time as possible.
How should the analyst best create a data source to meet these requirements?