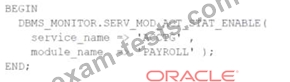
You need to collect and aggregate statistics for the ACCTG service and PAYROLL module, and execute: Where do you find the output of this command?
Correct Answer: A
When you enable statistics gathering for a specific service and module using DBMS_MONITOR.SERV_MOD_ACT_STAT_ENABLE, the output is aggregated and can be viewed using theV$SERV_MOD_ACT_STATSdynamic performance view. This view contains the cumulative statistics of database activity broken down by service and module, which is exactly what you collect when executing the provided command. * B (Incorrect):While many types of trace files are located in the Diagnostic Destination directory ( $ORACLE_BASE/diag), the aggregated statistics for services and modules are not written to trace files but are instead viewable through dynamic performance views. * C (Incorrect):TheV$SERVICE_STATSview provides service-level statistics but does not provide the * combined service/module-level breakdown. * D (Incorrect):The output of the PL/SQL block is not written to a file in the current working directory; it is stored in the data dictionary and accessible via dynamic performance views. References: * Oracle Database PL/SQL Packages and Types Reference:DBMS_MONITOR * Oracle Database Reference:V$SERV_MOD_ACT_STATS
Question 17
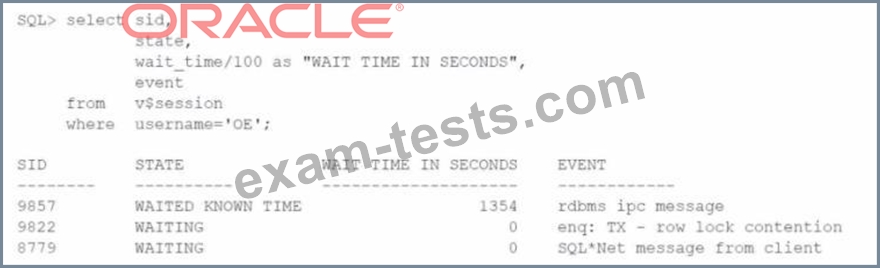
Examine this statement and output: Which three statements are true?
Correct Answer: B,E,F
For this SQL statement and output, we can analyze the EVENT column to understand the type of wait: B: The event "SQL*Net message from client" typically indicates that the session is waiting for a response from the client. This can be due to a network issue, user response, or an application processing delay. E: The event "SQL*Net message from client" also implies that the session is idle waiting for the client (a user or an application) to send a request to the server. This event usually indicates that the session is not actively working but is instead waiting for the next command. F: The wait event "enq: TX - row lock contention" suggests that session 9822 is waiting for a row-level lock held by another session. If the holding session issues a COMMIT or ROLLBACK, the lock will be released, and session 9822 will stop waiting. Since this session is experiencing row lock contention, it implies it's waiting for a specific transaction to complete. References: * Oracle Database Reference, 19c * Oracle Wait Events Documentation
Question 18
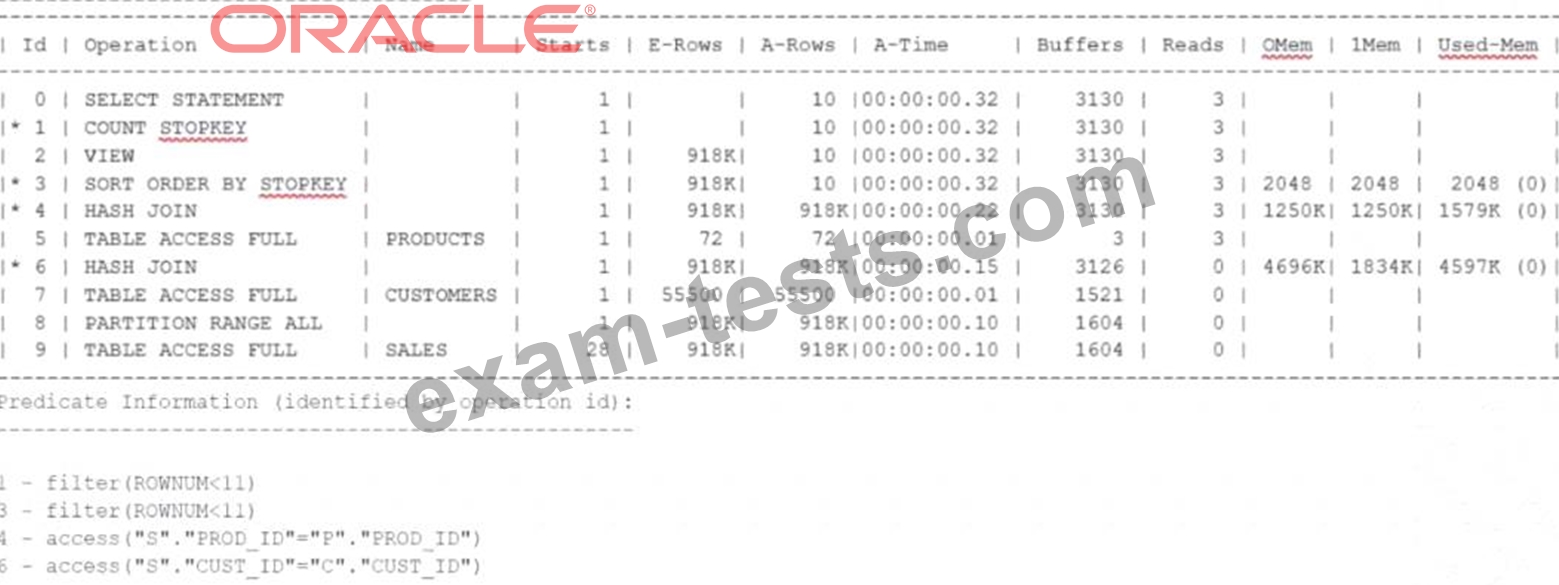
You must write a statement that returns the ten most recent sales. Examine this statement: Users complain that the query executes too slowly. Examine the statement's current execution plan: What must you do to reduce the execution time and why?
Correct Answer: A
The execution plan shows a full table access for theSALEStable. To reduce the execution time, creating an index onSALES.TIME_IDwould be beneficial as it would allow the database to quickly sort and retrieve the most recent sales without the need to perform a full table scan, which is I/O intensive and slower. By indexing TIME_ID, which is used in theORDER BYclause, the optimizer can take advantage of the index to efficiently sort and limit the result set to the ten most recent sales. * B (Incorrect):ReplacingFETCH FIRSTwithROWNUMwould not necessarily improve the performance unless there is an appropriate index that the optimizer can use to avoid sorting the entire result set. * C (Incorrect):There is no indication that the current statistics are inaccurate; hence, collecting new statistics may not lead to performance improvement. * D (Incorrect):While adaptive plans can provide performance benefits by allowing the optimizer to adapt the execution strategy, the main issue here is the lack of an index on theORDER BYcolumn. * E (Incorrect):Creating an index onSALES.CUST_IDcould improve join performance but would not address the performance issue caused by the lack of an index on theORDER BYcolumn. References: * Oracle Database SQL Tuning Guide:Managing Indexes * Oracle Database SQL Tuning Guide:Using Indexes and Clusters
Question 19
Which two options are part of a Soft Parse operation?
Correct Answer: C
Question 20
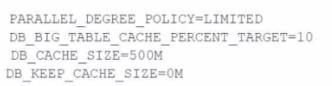
A database instance is suffering poor I/O performance on two frequently accessed large tables. No Big Table caching occurs in the database. Examine these parameter settings: Which are two actions either one of which will allow Big Table caching to occur?
Correct Answer: C,D
Big Table caching is a feature that allows frequently accessed large tables to be cached in memory to improve I/O performance. From the parameter settings provided, Big Table caching is not occurring because DB_BIG_TABLE_CACHE_PERCENT_TARGET is set to 10, which is the minimum threshold for enabling the feature, but the size of the cache is too small for the big tables to be effectively cached. To enable Big Table caching, one of the following actions could be taken: * C (Correct): Increasing DB_BIG_TABLE_CACHE_PERCENT_TARGET to at least 25. This action would allocate a larger percentage of the buffer cache for storing big tables, which could allow for caching large tables and thus improve I/O performance. * D (Correct): Increasing DB_CACHE_SIZE to 1G. Since the size of the buffer cache is a determining factor for how much data can be cached, increasing this parameter would provide more memory space for big tables to be cached. Options A, B, E, and F will not enable Big Table caching because: * A: Increasing DB_BIG_TABLE_CACHE_PERCENT_TARGET to 50 without adjusting the overall size of the cache might still not be sufficient if the DB_CACHE_SIZE is not large enough to hold the big tables. * B: Setting DB_KEEP_CACHE_SIZE to at least 50M only specifies a separate buffer pool for objects with the KEEP cache attribute and does not affect Big Table caching. * E: and F: Changing the PARALLEL_DEGREE_POLICY to ADAPTIVE or AUTO influences the behavior of parallel execution but does not directly enable or influence Big Table caching. References: * Oracle Database Performance Tuning Guide: Big Table Caching * Oracle Database Reference: DB_BIG_TABLE_CACHE_PERCENT_TARGET * Oracle Database Reference: DB_CACHE_SIZE