

Question 166
In determining free cash flows, how is the change in net working capital calculated?
Question 167
A city planner believes that as people's income rises, they are less likely to travel to work using public transportation or carpools. To see whether this belief is substantiated, the city planner gathers data from the 50 U.S. states on mean household income (in thousands of dollars) as well as the percent of people who take public transportation or carpool to work. The results for this regression are given below.
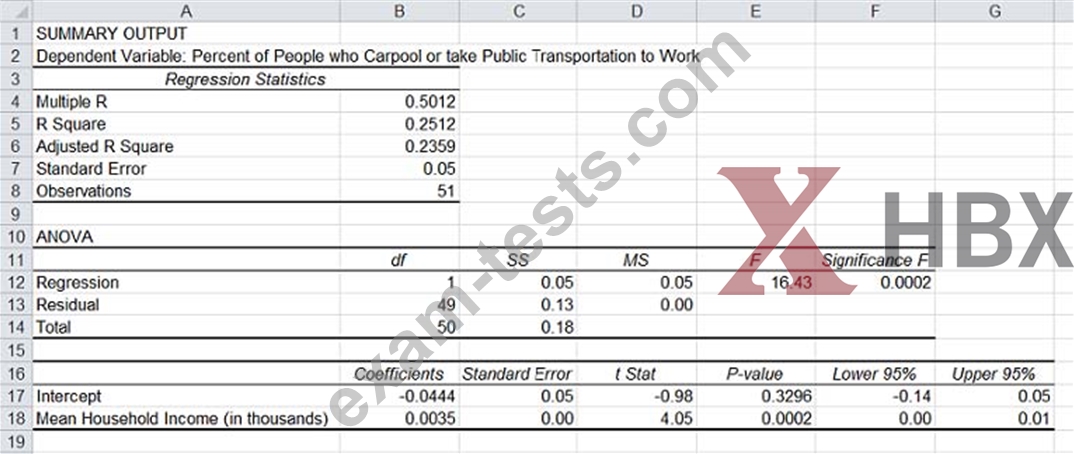
Which of the following Excel formulas would correctly forecast the dependent variable for a state with a mean household income of $37,000?
Which of the following Excel formulas would correctly forecast the dependent variable for a state with a mean household income of $37,000?
Question 168
A company had the following liabilities on Dec. 31, 2013:

What amount should the company report as current liabilities on its Dec. 31, 2013 balance sheet?
What amount should the company report as current liabilities on its Dec. 31, 2013 balance sheet?
Question 169
A government agency is interested in developing the most accurate forecast for the poverty rate in the United States and decides to perform regression analyses using a combination of the following independent variables: the percent of women in the labor force and the percent of the population that is uninsured. The agency collects data from all 50 U.S. states but is unsure whether both variables should be in the model. The agency runs three regressions:
Regression A. Poverty Rate = a + b1*(Percent of women in the labor force) + b2*(Percent uninsured)
Regression B. Poverty Rate = a + b*(Percent of women in the labor force)
Regression C. Poverty Rate = a + b*(Percent uninsured)

The regression statistics for all three regressions are given below. Based on these statistics, which model should the agency use to obtain the MOST accurate forecast?
Regression A. Poverty Rate = a + b1*(Percent of women in the labor force) + b2*(Percent uninsured)
Regression B. Poverty Rate = a + b*(Percent of women in the labor force)
Regression C. Poverty Rate = a + b*(Percent uninsured)
The regression statistics for all three regressions are given below. Based on these statistics, which model should the agency use to obtain the MOST accurate forecast?
Question 170
A new smartphone is being released at a price of $100. A customer with a willingness to pay (WTP) of $105 walks to the store, sees that there is a long line, and decides to leave. Another customer with a WTP of $113 arrives at the store at the same time and decides to wait in the line. What can an observer deduce from this observation?