A hospital has been experiencing a significant Increase in the number of medication errors. The hospital's governing board has adopted barcoding technology with electronic documentation at the point of care. Which of the following medication errors will most likely be reduced by the Implementation of this technology?
Correct Answer: C
Barcoding technology with electronic documentation at the point of care is primarily designed to reduce medication errors that occur during the administration stage123. This technology, known as Bar-coded Medication Administration (BCMA), provides point-of-care verification of the correct patient and medication3. When a medication is administered, the healthcare professional scans the barcode on the patient's identification band and the barcode on the medication. The system then checks the scanned information against the medication order in the patient's electronic health record. This process helps ensure that the right patient is receiving the right medication at the right dose and at the right time, thereby significantly reducing administration errors1234. While barcoding technology can also help reduce other types of errors such as dispensing errors3, its impact is most significant on administration errors. Therefore, in the context of the question, the implementation of barcoding technology with electronic documentation at the point of care will most likely reduce administration errors.
Question 442
A recent analysis reveals that reimbursement projection Is being negatively Impacted by post-surgical respiratory failure rates. What Is the first step to address this issue?
Correct Answer: D
When a healthcare organization identifies a problem that is impacting its performance, such as post-surgical respiratory failure rates negatively impacting reimbursement projections, the first step is typically to gather more information about the issue123. In this case, the best way to do that would be to obtain a list of the patients identified by this code and conduct a retrospective review (Option D)123. This would allow the organization to look back at the medical records of these patients to understand more about their cases, including potential risk factors, the course of their treatment, and the outcomes they experienced123. This information can then be used to identify patterns or trends that might be contributing to the high rates of post-surgical respiratory failure123. For example, the review might reveal that certain surgical procedures, patient characteristics, or care practices are associated with a higher risk of respiratory failure123. Once this information has been gathered and analyzed, the organization can then move on to the next steps in the quality improvement process, such as identifying potential interventions, implementing changes, and monitoring their impact123. References: 123
Question 443
In preparation for a provider organization accreditation survey, the most effective method for identifying training needs for staff is
Correct Answer: A
The most effective method for identifying training needs in preparation for an accreditation survey is conducting a gap analysis with an interdisciplinary team. A gap analysis compares the current state of staff competencies and organizational processes with the standards required for accreditation. Involving an interdisciplinary team ensures that all aspects of care and service are considered, leading to a comprehensive identification of training needs across different roles and departments. * Benchmarking with other organizations (B): While benchmarking can provide useful comparisons, it may not directly identify the specific training needs of your staff. * Engaging a consultant to identify areas needing improvement (C): A consultant can be helpful, but an internal gap analysis is more effective in creating ownership of the process and addressing specific accreditation requirements. * Comparing competency requirements with other facilities (D): This can be part of benchmarking but does not provide the direct, internal insights that a gap analysis offers. References * NAHQ Body of Knowledge: Accreditation Preparation and Gap Analysis * NAHQ CPHQ Exam Preparation Materials: Identifying Training Needs for Accreditation =========
Question 444
The term __________ brings in mind that indicator panel on an automobile, which is most useful when t he car is moving as a way for t he driver t o monitor key performance metrics such as speed, fuel level, engine performance, temperature and direction from digital display units.
Correct Answer: B
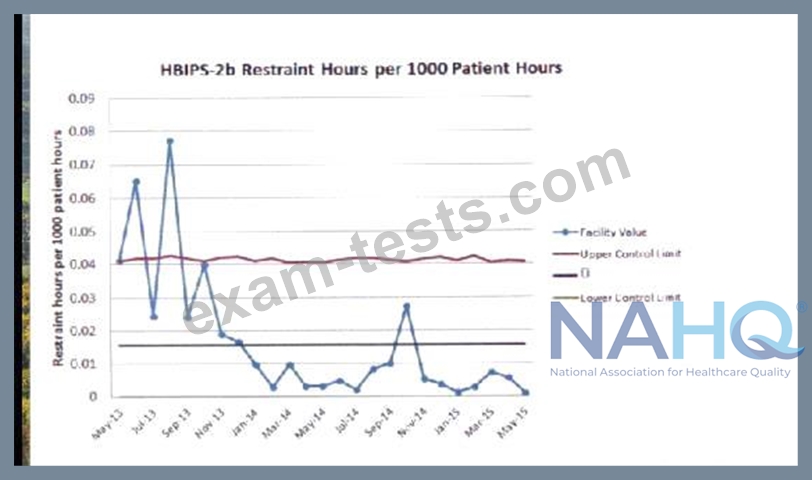
Question 445
The control chart above indicates which of the following?
Correct Answer: B
* Understanding Control Charts and Variation TypesControl charts are used to monitor process stability over time by identifying different types of variation. Variations on a control chart can generally be categorized as: * Common Cause Variation: Random variation that is inherent to the process, typically within control limits. * Special Cause Variation: Variation that is unusual, not inherent to the process, and suggests an external factor or a change in the process. * Unique Cause Variation: This term is not commonly used in statistical process control; it likely refers to a special or unusual cause. * No Variation: Indicates a completely stable process with no changes over time, which is rarely the case in practice. * Interpreting the Control ChartThe control chart shows the rate of restraint hours per 1000 patient hours over time. Key indicators of special cause variation include: * Data points outside the control limits (Upper Control Limit and Lower Control Limit). * Patterns, such as runs of data points above or below the mean, or sudden shifts and spikes in data. In this chart, we see several spikes (particularly in July and September of 2013 and again in October 2014) that reach or exceed the upper control limit. This suggests that certain events or changes in these periods caused the restraint hours to increase significantly, which is not due to the inherent process variation. * Conclusion for the Correct AnswerSince the chart displays data points that go outside the control limits and exhibit unusual patterns, it is indicative of Special Cause Variation. This suggests external factors or specific changes in the facility process during those periods that require further investigation to determine the cause of the spikes. References: NAHQ Documentation on Control Charts and Process Variation "Using Statistical Process Control to Monitor Quality Improvement in Healthcare" (NAHQ, 2019)