
Question 116
An electronics firm was experiencing high rejections in their multiple connector manufacturing departments. "p" charts were introduced as part of a program to reduce defectives. Control limits were based on prior history, using the formula:
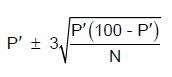
P' is the historical value of percent defective and n is the number of pieces inspected each week. After six weeks, the following record was accumulated
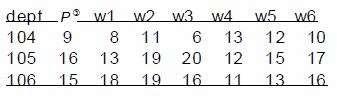
1,000 pieces were inspected each week in each department. Which department(s) exhibited a point or points out of control during this period (round off calculations to nearest tenth of a percentage point)?
P' is the historical value of percent defective and n is the number of pieces inspected each week. After six weeks, the following record was accumulated
1,000 pieces were inspected each week in each department. Which department(s) exhibited a point or points out of control during this period (round off calculations to nearest tenth of a percentage point)?
Question 117
When using a control chart, a point plotting within the limits on the chart is
Question 118
Inspection operations typically