
Question 71
You have sales data in a star schema that contains four tables named Sales, Customer, Date, and Product. The Sales table contains purchase and ship dates.
Most often, you will use the purchase date to analyze the data, but you will analyze the data by both dates independently and together.
You need to design an imported dataset to support the analysis. The solution must minimize the model size and the number of queries against the data source.
Which data modeling design should you use?
Question 72
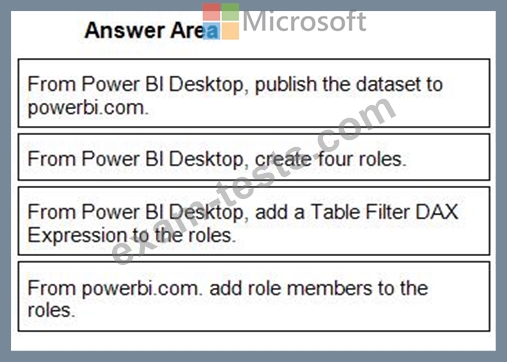
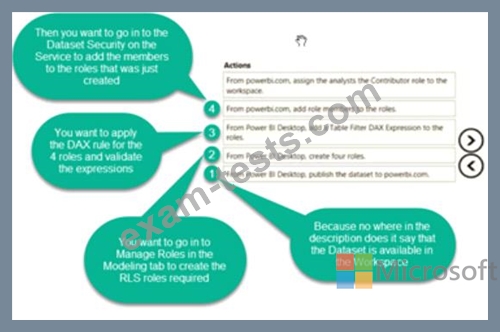
Once the profit and loss dataset is created, which four actions should you perform in sequence to ensure that the business unit analysts see the appropriate profit and loss data? To answer, move the appropriate actions from the list of actions to the answer area and arrange them in the correct order.

Question 73
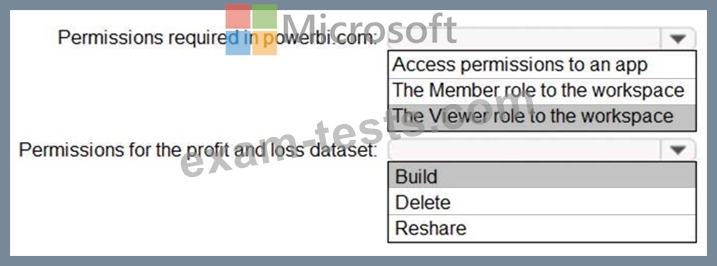
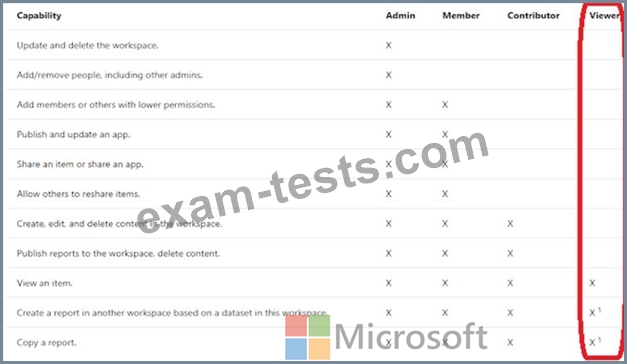
You need to grant access to the business unit analysts.
What should you configure? To answer, select the appropriate options in the answer area.
NOTE: Each correct selection is worth one point.

What should you configure? To answer, select the appropriate options in the answer area.
NOTE: Each correct selection is worth one point.

Question 74
You have a Microsoft Power Bl dashboard. The report used to create the dashboard uses an imported dataset from a Microsoft SQL Server data source. The dashboard is shown in the exhibit. (Click the Exhibit tab.)

What occurred at 12:03:06 PM?
What occurred at 12:03:06 PM?
Question 75
Case Study 1 - Litware, Inc.
Overview
Litware, Inc. is an online retailer that uses Microsoft Power Bl dashboards and reports. The company plans to leverage data from Microsoft SQL Server databases, Microsoft Excel files, text files, and several other data sources.
Litware uses Azure Active Directory (Azure AD) to authenticate users.
Existing Environment
Sales Data
Litware has online sales data that has the SQL schema shown in the following table.

In the Date table, the dateid column has a format of yyyymmdd and the month column has a format of yyyymm. The week column in the Date table and the weekid column in the Weekly_Returns table have a format of yyyyww. The regionid column can be managed by only one sales manager.
Data Concerns
You are concerned with the quality and completeness of the sales data. You plan to verify the sales data for negative sales amounts.
Reporting Requirements
Litware identifies the following technical requirements:
- Executives require a visual that shows sales by region.
- Regional managers require a visual to analyze weekly sales and
returns.
- Sales managers must be able to see the sales data of their respective region only.
- The sales managers require a visual to analyze sales performance
versus sales targets.
- The sale department requires reports that contain the number of sales transactions.
- Users must be able to see the month in reports as shown in the
following example: Feb 2020.
- The customer service department requires a visual that can be
filtered by both sales month and ship month independently.
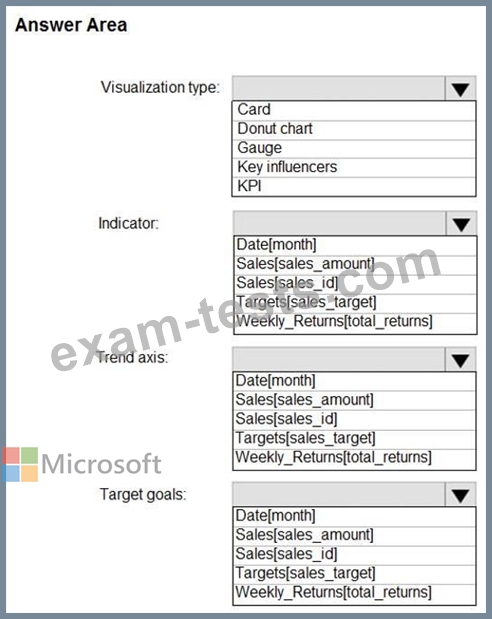
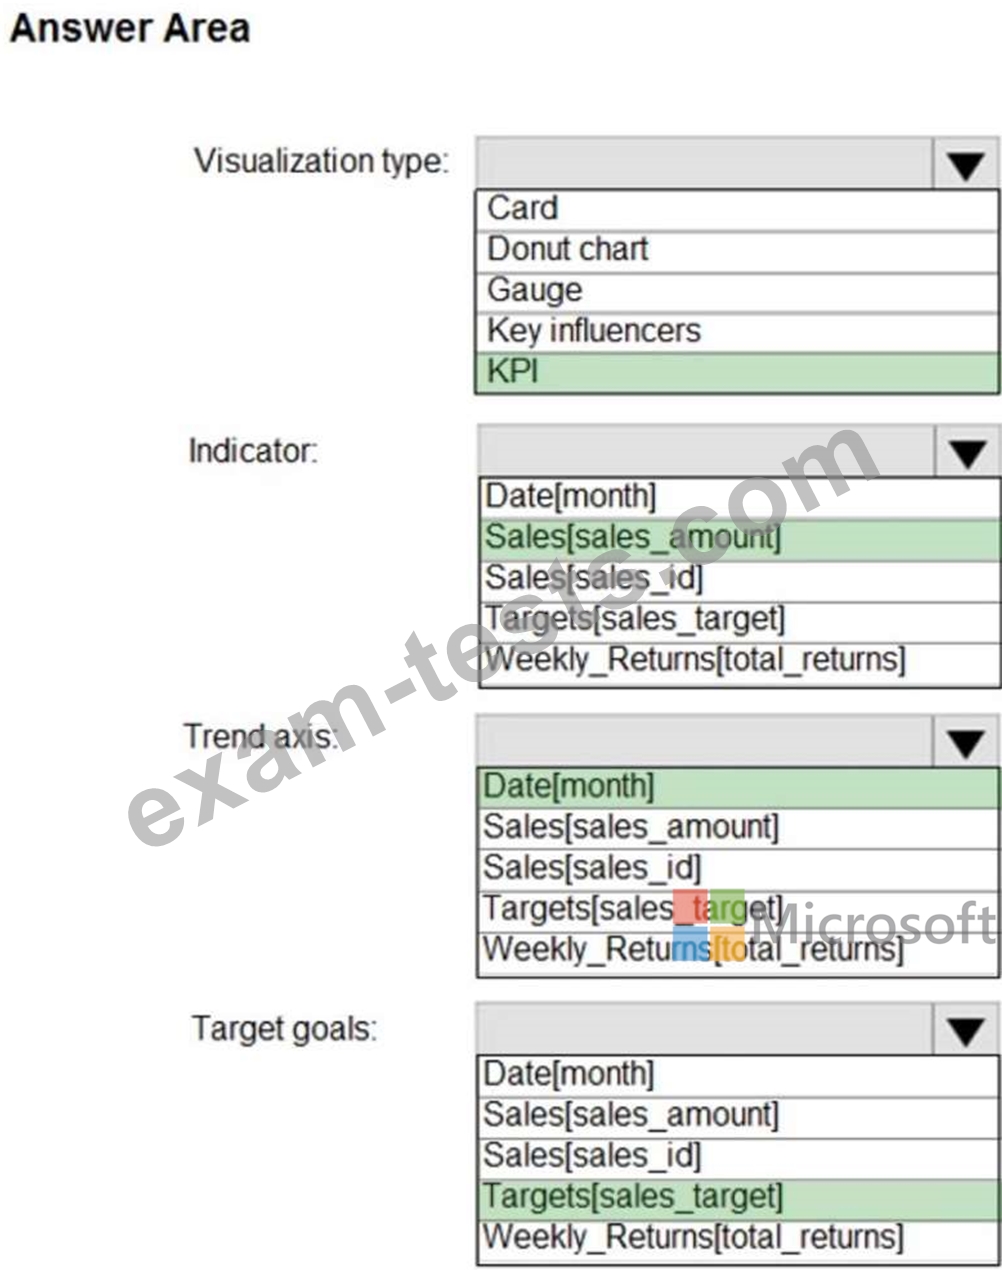
Hotspot Question
You need to create a visualization to meet the reporting requirements of the sales managers.
How should you create the visualization? To answer, select the appropriate options in the answer area. NOTE: Each correct selection is worth one point.
Overview
Litware, Inc. is an online retailer that uses Microsoft Power Bl dashboards and reports. The company plans to leverage data from Microsoft SQL Server databases, Microsoft Excel files, text files, and several other data sources.
Litware uses Azure Active Directory (Azure AD) to authenticate users.
Existing Environment
Sales Data
Litware has online sales data that has the SQL schema shown in the following table.
In the Date table, the dateid column has a format of yyyymmdd and the month column has a format of yyyymm. The week column in the Date table and the weekid column in the Weekly_Returns table have a format of yyyyww. The regionid column can be managed by only one sales manager.
Data Concerns
You are concerned with the quality and completeness of the sales data. You plan to verify the sales data for negative sales amounts.
Reporting Requirements
Litware identifies the following technical requirements:
- Executives require a visual that shows sales by region.
- Regional managers require a visual to analyze weekly sales and
returns.
- Sales managers must be able to see the sales data of their respective region only.
- The sales managers require a visual to analyze sales performance
versus sales targets.
- The sale department requires reports that contain the number of sales transactions.
- Users must be able to see the month in reports as shown in the
following example: Feb 2020.
- The customer service department requires a visual that can be
filtered by both sales month and ship month independently.
Hotspot Question
You need to create a visualization to meet the reporting requirements of the sales managers.
How should you create the visualization? To answer, select the appropriate options in the answer area. NOTE: Each correct selection is worth one point.
Premium Bundle
Newest DA-100 Exam PDF Dumps shared by BraindumpsPass.com for Helping Passing DA-100 Exam! BraindumpsPass.com now offer the updated DA-100 exam dumps, the BraindumpsPass.com DA-100 exam questions have been updated and answers have been corrected get the latest BraindumpsPass.com DA-100 pdf dumps with Exam Engine here: