
Question 76
You are modeling data in table named SalesDetail by using Microsoft Power Bl.
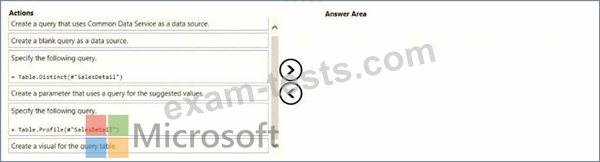
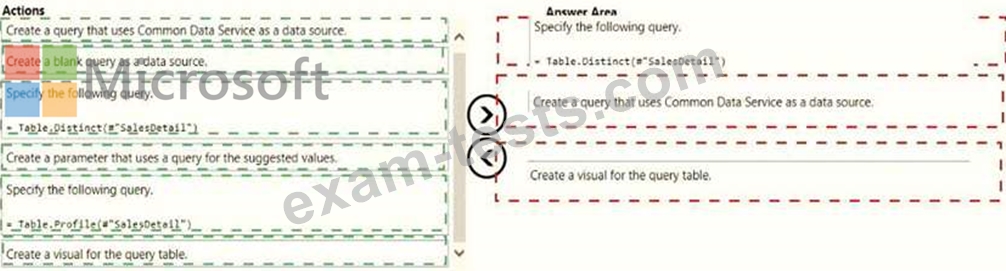
You need to provide end users with access to the summary statistics about the SalesDetail data. The users require insights on the completeness of the data and the value distributions.
Which three actions should you perform in sequence? To answer, move the appropriate actions from the list of actions to the answer area and arrange them in the correct order.
Question 77
Note: This question is part of a series of questions that present the same scenario. Each question in the series contains a unique solution that might meet the stated goals. Some question sets might have more than one correct solution, while others might not have a correct solution.
After you answer a question in this scenario, you will NOT be able to return to it. As a result, these questions will not appear in the review screen.
You have a clustered bar chart that contains a measure named Salary as the value and a field named Employee as the axis. Salary is present in the data as numerical amount representing US dollars.
You need to create a reference line to show which employees are above the median salary.
Solution: You create a median line by using the Salary measure.
Does this meet the goal?
Question 78
Your company has affiliates who help the company acquire customers.
You build a report for the affiliate managers at the company to assist them in understanding affiliate performance.
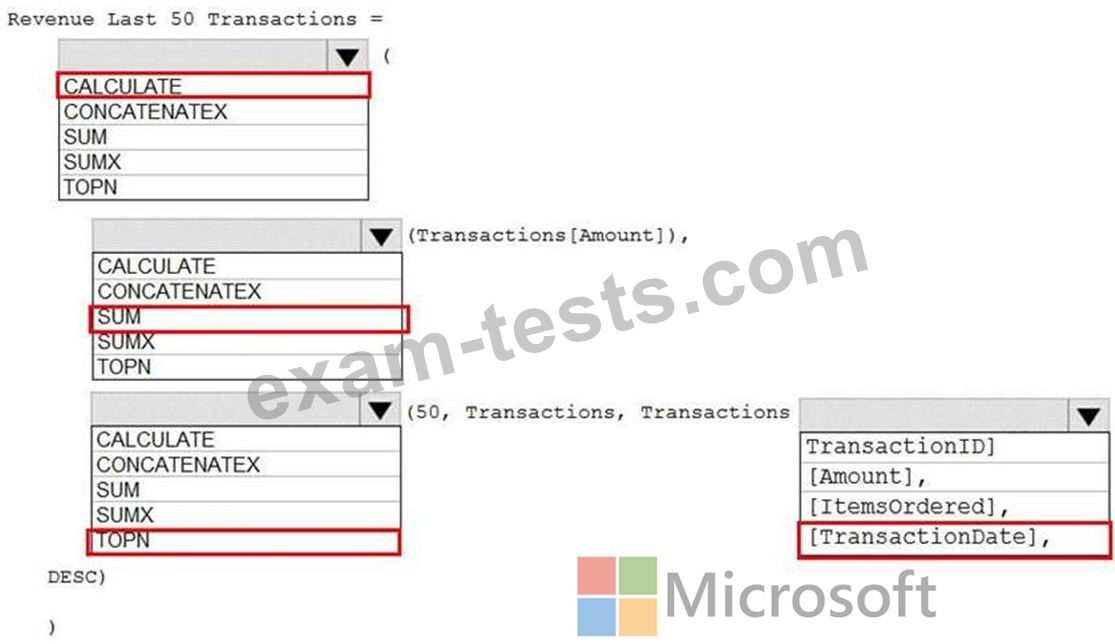
The managers request a visual showing the total sales value of the latest 50 transactions for each affiliate. You have a data model that contains the following tables.

You need to develop a measure to support the visual.
How should you complete the DAX expression? To answer, select the appropriate options in the answer area.
NOTE: Each correct selection is worth one point.

You build a report for the affiliate managers at the company to assist them in understanding affiliate performance.
The managers request a visual showing the total sales value of the latest 50 transactions for each affiliate. You have a data model that contains the following tables.
You need to develop a measure to support the visual.
How should you complete the DAX expression? To answer, select the appropriate options in the answer area.
NOTE: Each correct selection is worth one point.
Question 79
Hotspot Question
You are creating a Microsoft Power Bl imported data model to perform basket analysis. The goal of the analysis is to identify which products are usually bought together in the same transaction across and within sales territories.
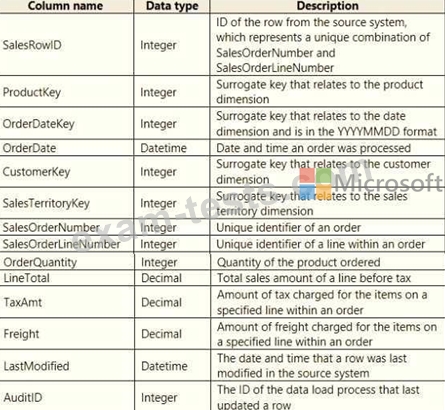
You import a fact table named Sales as shown in the exhibit. (Click the Exhibit tab.)
The related dimension tables are imported into the model.
Sales contains the data shown in the following table.
For each of the following statements, select Yes if the statement is true. Otherwise, select No.
NOTE: Each correct selection is worth one point.

You are creating a Microsoft Power Bl imported data model to perform basket analysis. The goal of the analysis is to identify which products are usually bought together in the same transaction across and within sales territories.
You import a fact table named Sales as shown in the exhibit. (Click the Exhibit tab.)
The related dimension tables are imported into the model.
Sales contains the data shown in the following table.
For each of the following statements, select Yes if the statement is true. Otherwise, select No.
NOTE: Each correct selection is worth one point.

Question 80
You have sales data in a star schema that contains four tables named Sales, Customer, Date, and Product.
The Sales table contains purchase and ship dates.
Most often, you will use the purchase date to analyze the data, but you will analyze the data by both dates independently and together.
You need to design an imported dataset to support the analysis. The solution must minimize the model size and the number of queries against the data source.
Which data modeling design should you use?