Question 31
Your company has affiliates who help the company acquire customers.
You build a report for the affiliate managers at the company to assist them in understanding affiliate performance.
The managers request a visual showing the total sales value of the latest 50 transactions for each affiliate. You have a data model that contains the following tables.

You need to develop a measure to support the visual.
How should you complete the DAX expression? To answer, select the appropriate options in the answer area.
NOTE: Each correct selection is worth one point.

You build a report for the affiliate managers at the company to assist them in understanding affiliate performance.
The managers request a visual showing the total sales value of the latest 50 transactions for each affiliate. You have a data model that contains the following tables.
You need to develop a measure to support the visual.
How should you complete the DAX expression? To answer, select the appropriate options in the answer area.
NOTE: Each correct selection is worth one point.

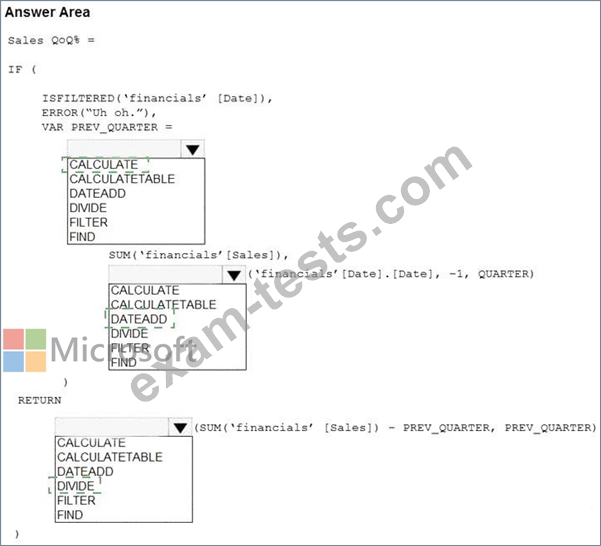
Question 32
You need to create a DAX measure in the data model that only allows users to see projections at the appropriate levels of granularity.
How should you complete the measure? To answer, drag the appropriate values to the correct targets. Each value may be used once, more than once, or not at all. You may need to drag the split bar between panes or scroll to view content.
NOTE: Each correct selection is worth one point.

How should you complete the measure? To answer, drag the appropriate values to the correct targets. Each value may be used once, more than once, or not at all. You may need to drag the split bar between panes or scroll to view content.
NOTE: Each correct selection is worth one point.

Question 33
Note: This question is part of a series of questions that present the same scenario. Each question in the series contains a unique solution that might meet the stated goals. Some question sets might have more than one correct solution, while others might not have a correct solution.
After you answer a question in this scenario, you will NOT be able to return to it. As a result, these questions will not appear in the review screen.
You have several reports and dashboards in a workspace.
You need to grant all organizational users read access to a dashboard and several reports.
Solution: You assign all the users the Viewer role to the workspace.
Does this meet the goal?
Question 34
You have a Microsoft Power Bl dashboard. The report used to create the dashboard uses an imported dataset from a Microsoft SQL Server data source. The dashboard is shown in the exhibit. (Click the Exhibit tab.)
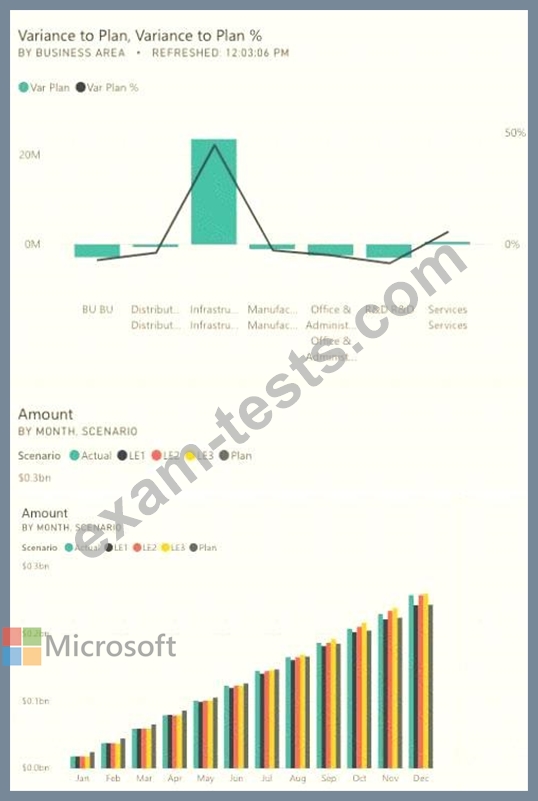
What occurred at 12:03:06 PM?
What occurred at 12:03:06 PM?
Question 35
You have the line chart shown in the exhibit. (Click the Exhibit tab.)

You need to modify the chart to meet the following requirements:
* Identify months that have order counts above the mean.
* Display the mean monthly order count.
Which three actions should you perform in sequence? To answer, move the appropriate actions from the list of actions to the answer area and arrange them in the correct order.