
Question 21
You create a dashboard by using the Microsoft Power Bl Service. The dashboard contains a card visual that shows total sales from the current year. You grant users access to the dashboard by using the viewer role on the workspace. A user wants to receive daily notifications of the number shown on the card visual. You need to automate the notifications. What should you do?
Question 22
You receive revenue data that must be included in Microsoft Power Bl reports.
You perform an initial load of the data from a Microsoft Excel source as shown in the following exhibit.
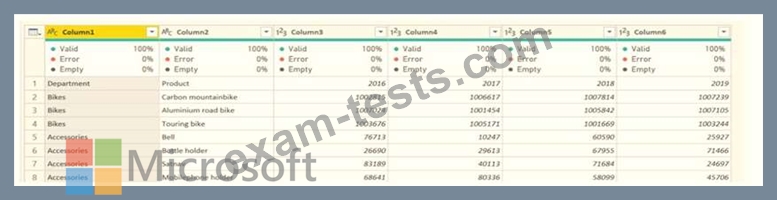
You plan to create several visuals from the data, including a visual that shows revenue split by year and product.
You need to transform the data to ensure that you can build the visuals. The solution must ensure that the columns are named appropriately for the data that they contain.

You perform an initial load of the data from a Microsoft Excel source as shown in the following exhibit.
You plan to create several visuals from the data, including a visual that shows revenue split by year and product.
You need to transform the data to ensure that you can build the visuals. The solution must ensure that the columns are named appropriately for the data that they contain.

Question 23
You view a query named Transactions as shown in the following exhibit.

The query gets CSV files from a folder.
Use the drop-down menus to select the answer choice that completes each statement based on the information presented in the graphic.
NOTE: Each correct selection is worth one point.

The query gets CSV files from a folder.
Use the drop-down menus to select the answer choice that completes each statement based on the information presented in the graphic.
NOTE: Each correct selection is worth one point.

Question 24
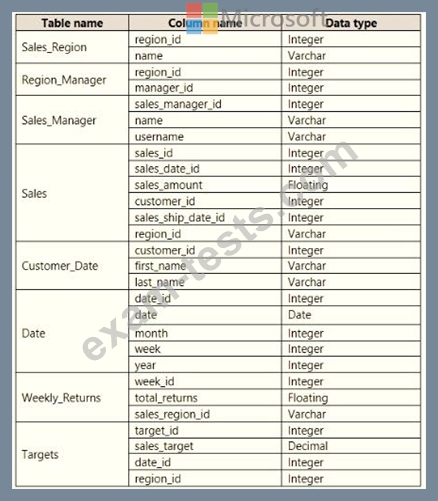
You need to create a visualization to meet the reporting requirements of the sales managers.
How should you create the visualization? To answer, select the appropriate options in the answer area.
NOTE: Each correct selection is worth one point.

How should you create the visualization? To answer, select the appropriate options in the answer area.
NOTE: Each correct selection is worth one point.


Question 25
You have a Power BI report. The report contains visualizations that have interactions. You need to identify which visualizations take the longest to complete. What should you use?