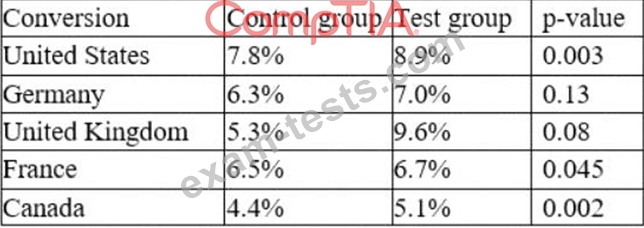
An e-commerce company recently tested a new website layout. The website was tested by a test group of customers, and an old website was presented to a control group. The table below shows the percentage of users in each group who made purchases on the websites: Which of the following conclusions is accurate at a 95% confidence interval?
Correct Answer: A
The p-value is a measure of how likely it is to observe a difference in conversion rates as large or larger than the one observed, assuming that there is no difference between the groups. A common threshold for statistical significance is 0.05, meaning that there is a 5% or less chance of observing such a difference by chance alone. The table shows the p-values for each country, and we can see that only Germany has a p-value above 0.05 (0.13). This means that we cannot reject the null hypothesis that there is no difference in conversion rates between the test and control groups in Germany. Therefore, the increase in conversion from the new layout was not significant in Germany. For the other countries, the p-values are below 0.05, indicating that the increase in conversion from the new layout was statistically significant. Option A is correct. Option B is incorrect because the increase in conversion from the new layout was significant in France (p- value = 0.002). Option C is incorrect because it does not account for the variation across countries. While the overall conversion rate for the test group (8.4%) is higher than the control group (6.8%), this difference may not be statistically significant when we consider the country-specific effects. Option D is incorrect because the new layout has the highest conversion rate in the United Kingdom (9.6%), not the lowest. References: * P-value Calculator & Statistical Significance Calculator * p-value Calculator | Formula | Interpretation * How to obtain the P value from a confidence interval | The BMJ * Confidence Intervals &P-values for Percent Change / Relative Difference
Question 17
A publishing group has requested a dashboard to track submissions before publication. A key requirement is that all changes are tracked, as multiple users will be checking out documents and editing them before submissions are considered final. Which of the following is the BEST way to meet this stakeholder requirement?
Correct Answer: A
Explanation A static report is a type of report that shows a snapshot of data at a specific point in time. A static report does not change or update automatically, unless the data source is refreshed or the report is regenerated. A static report is suitable for situations where the data does not change frequently or where historical data is needed for comparison or analysis. In this case, the data analyst is asked to create a sales report for the second-quarter 2020 board meeting, which will include a review of the business's performance through the second quarter. The board meeting will be held on July 15, 2020, after the numbers are finalized. This means that the data analyst does not need to show real-time or dynamic data, but rather a fixed and accurate view of the sales data for the second quarter. Therefore, a static report would be the best way to meet this stakeholder requirement. Therefore, the correct answer is A. References: What are Static Reports? | Sisense, Static vs Dynamic Reports - What's The Difference? | datapine
Question 18
Which of the following best describes a 95% confidence interval?
Correct Answer: C
Comprehensive and Detailed In-Depth Explanation: A95% confidence intervalis a statistical range, derived from sample data, that is likely to contain the true population mean. It reflects the degree of uncertainty or certainty in a sampling method. Option C:A set of ranges contains the population mean with 95% certainty. * Rationale:This statement accurately describes a 95% confidence interval. It means that if we were to take 100 different samples and compute a confidence interval for each sample, we would expect about 95 of the intervals to contain the true population mean. Option A:There is a 95% probability that a sample is within one standard deviation of the mean. * Rationale:This statement confuses confidence intervals with standard deviation. A 95% confidence interval pertains to the range within which the population mean is expected to lie, not the dispersion of individual sample points around the mean. Option B:A stated range may contain 95% of the population mean, 95% of the time. * Rationale:This statement is incorrect because the population mean is a single value, not something that can be 95%
Question 19
A cereal manufacturer wants to determine whether the sugar content of its cereal has increased over the years. Which of the following is the appropriate descriptive statistic to use?
Correct Answer: B
This is because percent change is a type of descriptive statistic that measures the relative change or difference of a variable over time, such as the sugar content of cereal over years in this case. Percent change can be used to determine whether the sugar content of cereal has increased over years by comparing the initial and final values of the sugar content, as well as calculating the ratio or proportion of the change. For example, percent change can be used to determine whether the sugar content of cereal has increased over years by finding out how much more (or less) sugar there is in cereal now than before, as well as expressing it as a fraction or a percentage of the original sugar content. The other descriptive statistics are not appropriate to use to determine whether the sugar content of cereal has increased over years. Here is why: * Frequency is a type of descriptive statistic that measures how often or how likely a value or an event occurs in a data set, such as how many times a certain sugar content appears in cereal in this case. Frequency does not measure the relative change or difference of a variable over time, but rather measures the occurrence or chance of a variable at a given time. * Variance is a type of descriptive statistic that measures how much the values in a data set vary or deviate from the mean or average of the data set, such as how much variation there is in sugar content among different cereals in this case. Variance does not measure the relative change or difference of a variable over time, but rather measures the dispersion or spread of a variable at a given time. * Mean is a type of descriptive statistic that measures the average value or central tendency of a data set, such as what is the typical sugar content of cereal in this case. Mean does not measure the relative change or difference of a variable over time, but rather measures the summary or representation of a variable at a given time.
Question 20
Which of the following is an example of a discrete data type?
Correct Answer: B
A discrete data type is a data type that can only take on a finite number of values, such as integers or categories. An example of a discrete data type is the number of kids, as it can only be a whole number. The other options are examples of continuous data types, as they can take on any value within a range. The length in inches or centimeters, the distance in miles or kilometers, and the weight in pounds or kilograms are all continuous data types. Reference: CompTIA Data+ (DA0-001) Practice Certification Exams | Udemy
Newest DA0-001 Exam PDF Dumps shared by BraindumpsPass.com for Helping Passing DA0-001 Exam! BraindumpsPass.com now offer the updated DA0-001 exam dumps, the BraindumpsPass.com DA0-001 exam questions have been updated and answers have been corrected get the latest BraindumpsPass.com DA0-001 pdf dumps with Exam Engine here: