

Question 26
A data analyst is designing a dashboard that will provide a story of sales and determine which site is providing the highest sales volume per customer. The analyst must choose an appropriate chart to include in the dashboard. The following data is available:
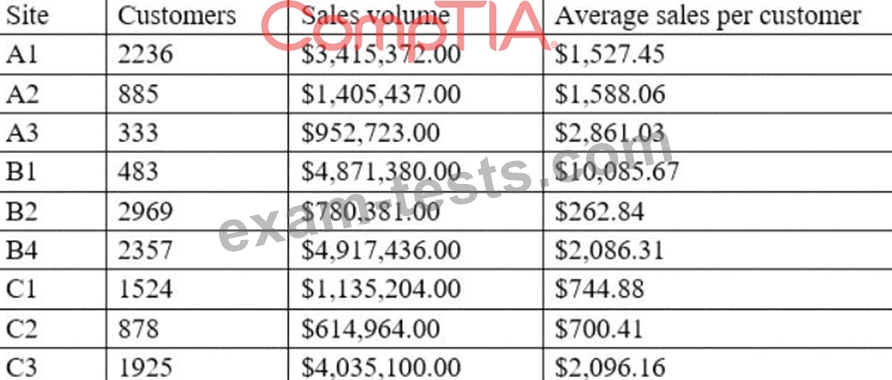
Which of the following types of charts should be considered?
Which of the following types of charts should be considered?
Question 27
Which of the following descriptive statistical methods are measures of central tendency? (Choose two.)
Question 28
A data analyst has been asked to derive a new variable labeled "Promotion_flag" based on the total quantity sold by each salesperson. Given the table below:
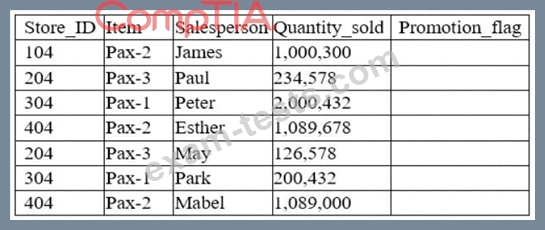
Which of the following functions would the analyst consider appropriate to flag "Yes" for every salesperson who has a number above 1,000,000 in the Quantity_sold column?
Which of the following functions would the analyst consider appropriate to flag "Yes" for every salesperson who has a number above 1,000,000 in the Quantity_sold column?
Question 29
An analyst has been asked to validate data quality. Which of the following are the BEST reasons to validate data for quality control purposes? (Choose two.)
Question 30
A report is scheduled to run and be distributed at the end of business each day. On Mondays, one of the recipients opens the previous week's reports and combines them to calculate the weekly totals and projections for the coming week. This is a tedious process, and the recipient asks an analyst for help. Which of the following should the analyst recommend?