Question 46
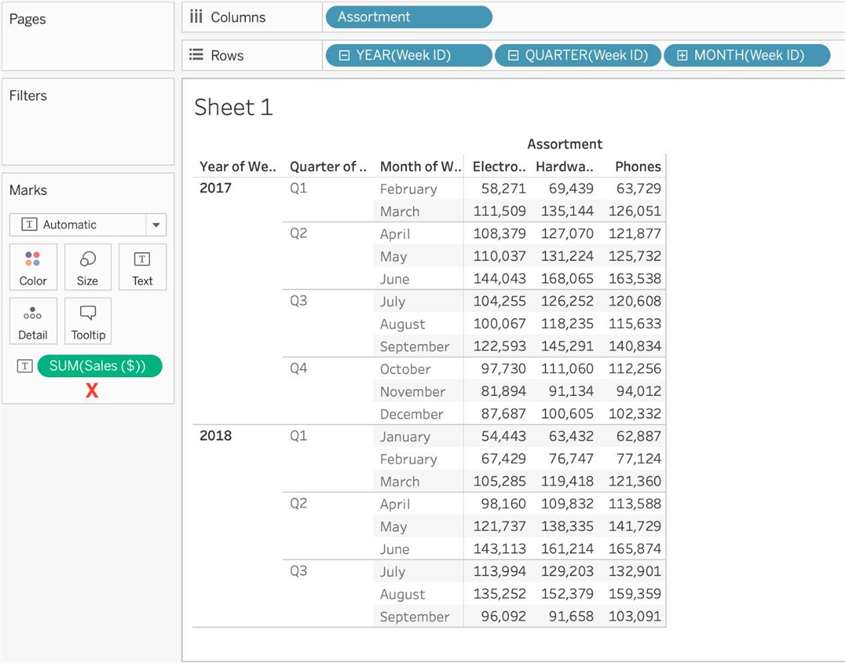
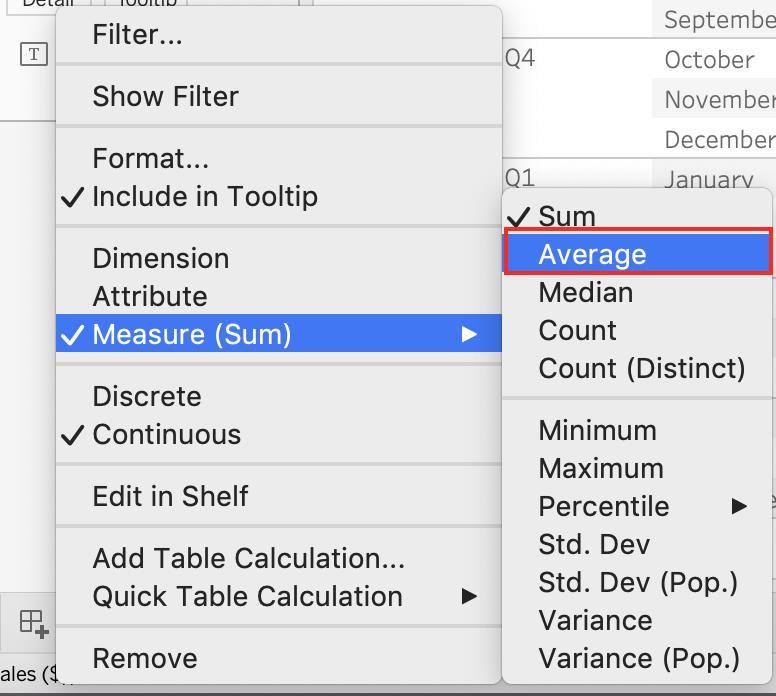
Using the Time Series table, create a cross-tab showing sales for each Assortment broken down by Year and Quarter. In Q4 of October 2017, what was the Average sales amount for the Hardware assortment?
Question 47
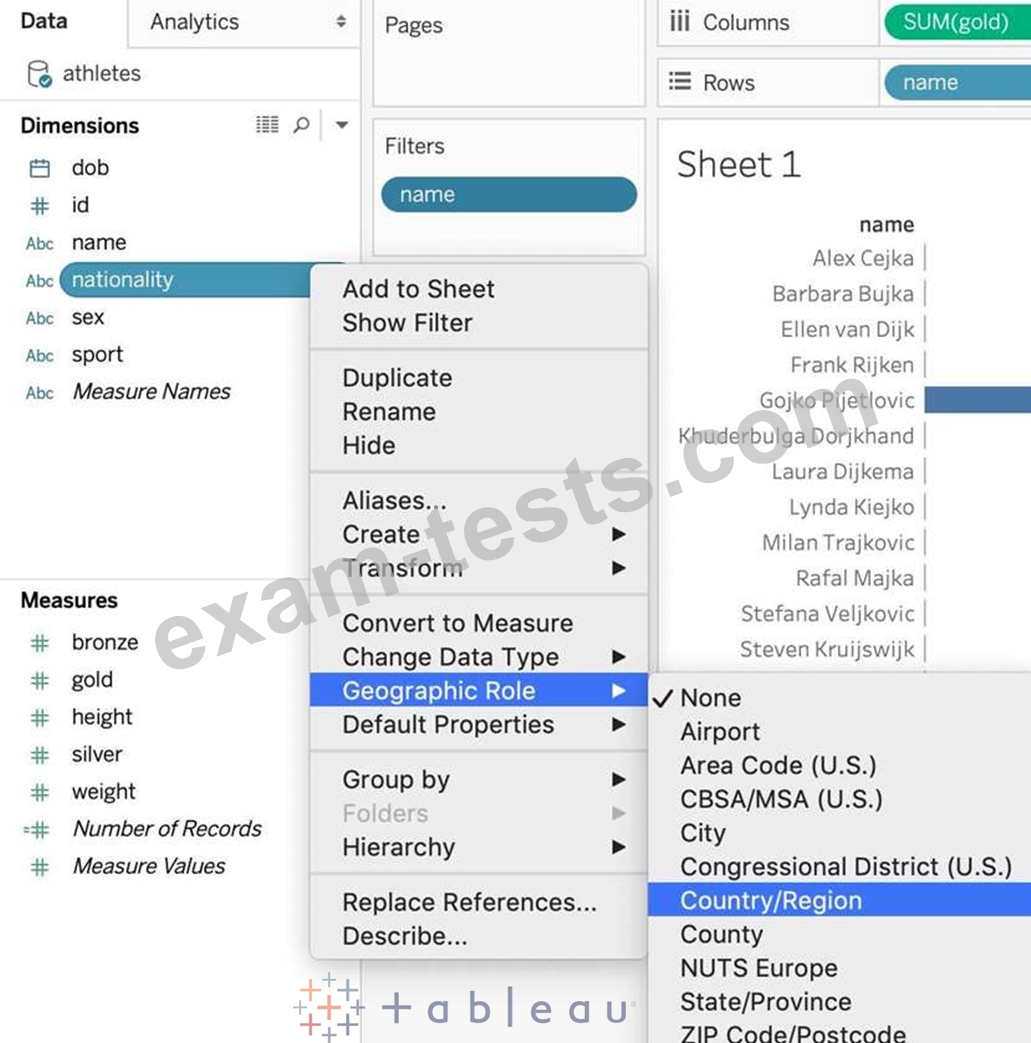
How can you MANUALLY assign geographic roles to a dimension from the data pane?
Question 48
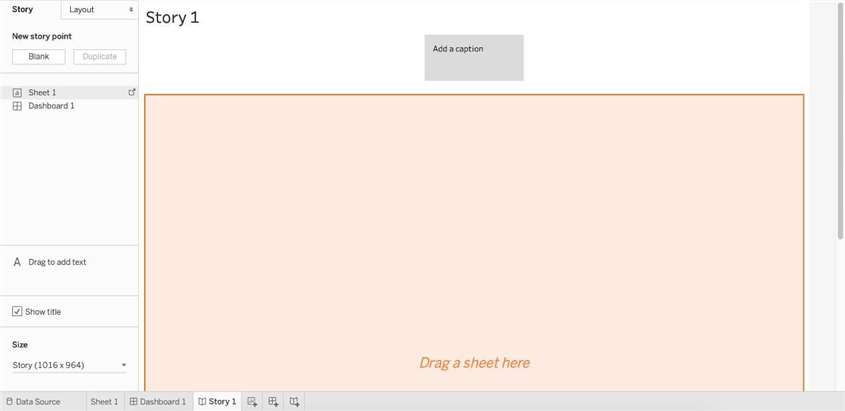
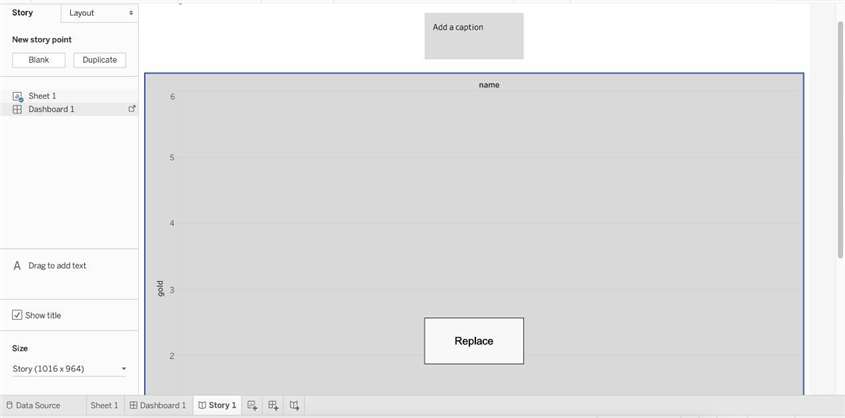
Is it possible to add both a Dashboard and a Worksheet at the same time to a Story Point in Tableau?
Question 49
Download the Dataset from:
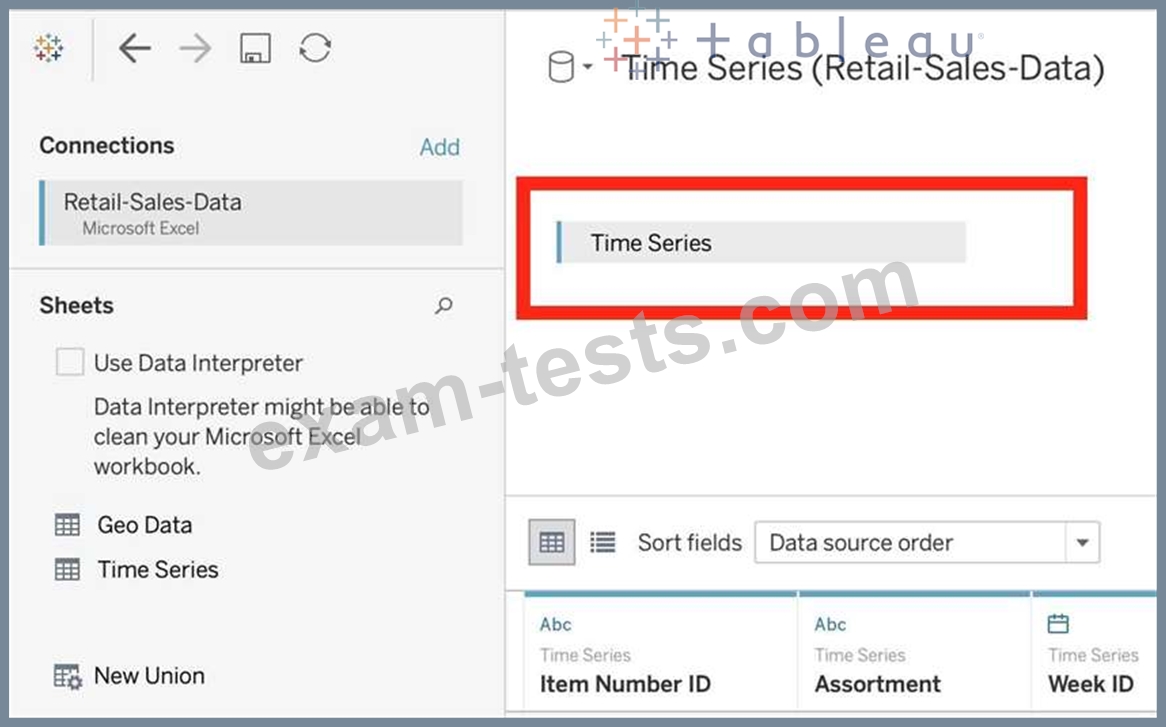
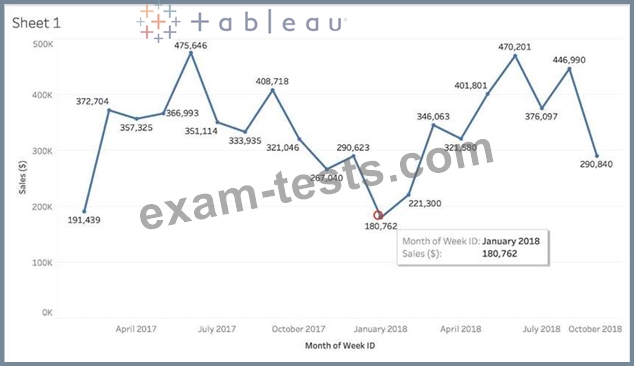
https://drive.google.com/file/d/12AYHfiPWkwBmvH0zbumOURgUX6Az00Rw/view?usp=sharing Using the Time Series Table, create a line chart to show Sales over time. Which Month and Year witnessed the lowest Sales?
https://drive.google.com/file/d/12AYHfiPWkwBmvH0zbumOURgUX6Az00Rw/view?usp=sharing Using the Time Series Table, create a line chart to show Sales over time. Which Month and Year witnessed the lowest Sales?
Question 50
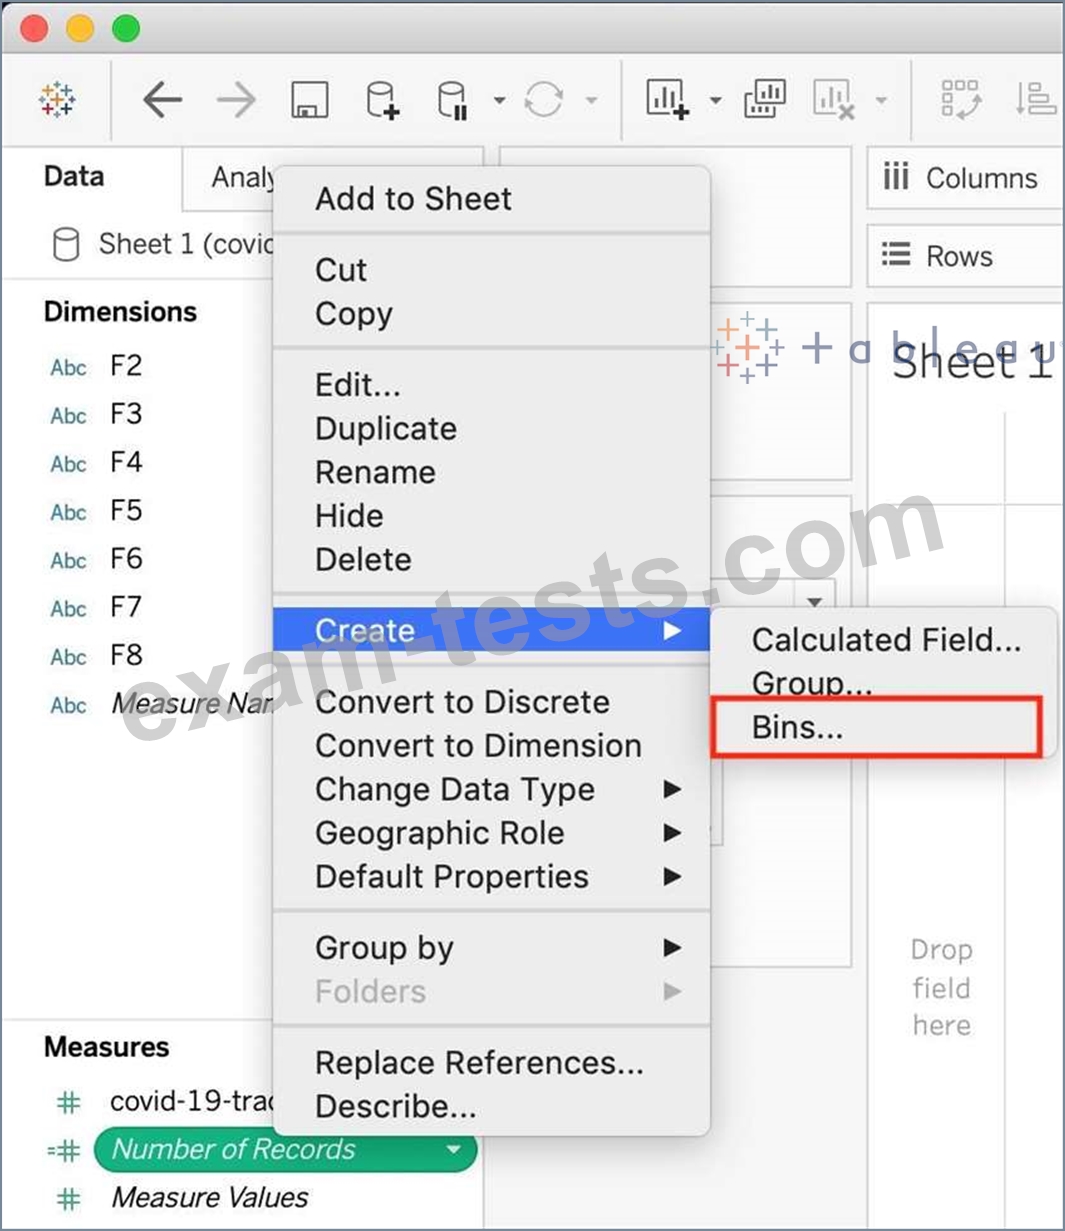
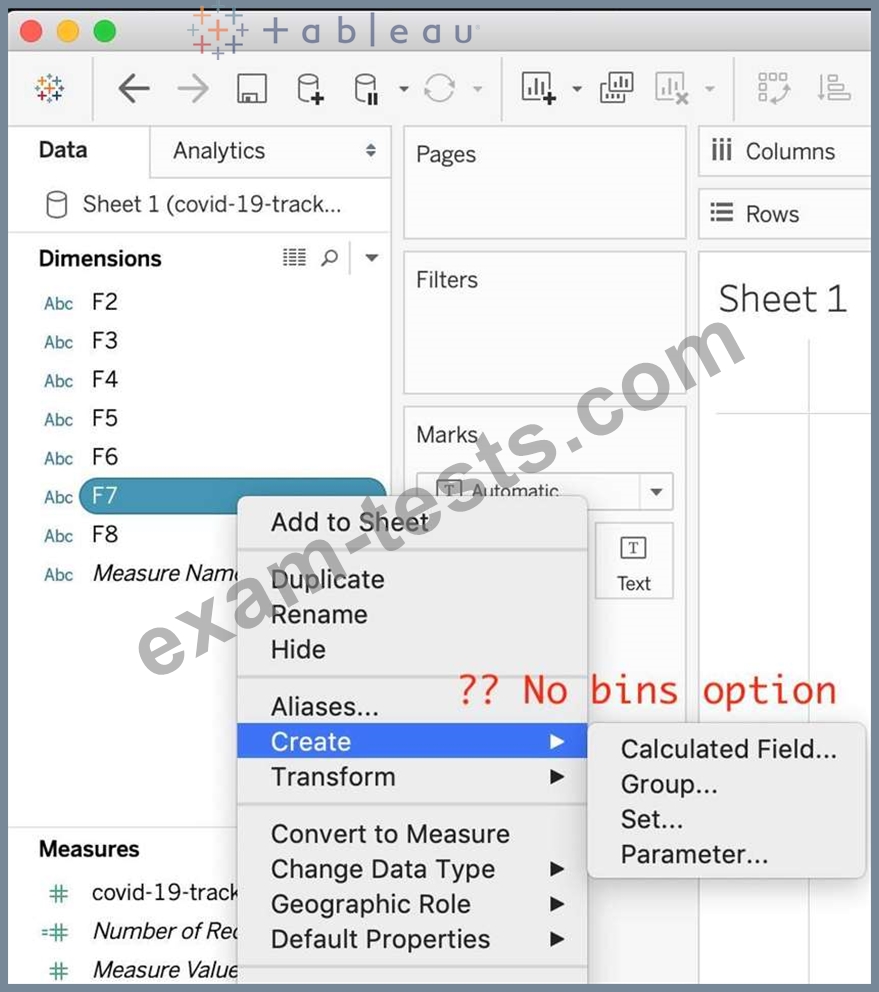
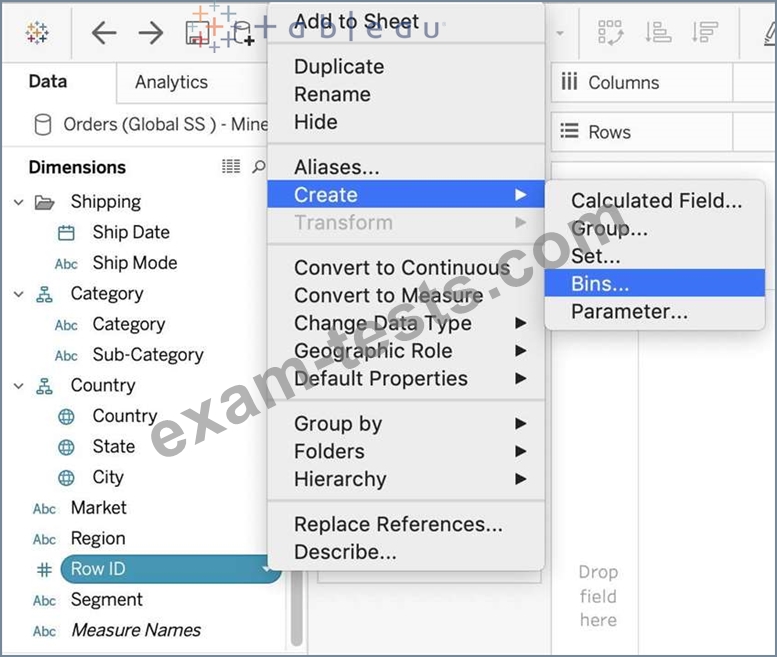
True or False : Bins can be created on dimensions