
Question 96
This question is part of a series of questions that present the same scenario.
Each question in the series contains a unique solution that might meet the stated goals. Some question sets might have more than one correct solution, while others might not have a correct solution.
After you answer a question in this scenario, you will NOT be able to return to it. As a result, these questions will not appear in the review screen.
You have a clustered bar chart that contains a measure named Salary as the value and a field named Employee as the axis. Salary is present in the data as numerical amount representing US dollars.
You need to create a reference line to show which employees are above the median salary.
Solution: You create a median line by using the Salary measure.
Does this meet the goal?
Question 97
In Power BI Desktop, you are building a sales report that contains two tables. Both tables have row-level security (RLS) configured.
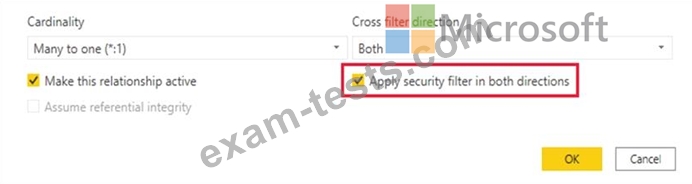
You need to create a relationship between the tables. The solution must ensure that bidirectional cross-filtering honors the RLS settings.
What should you do?
You need to create a relationship between the tables. The solution must ensure that bidirectional cross-filtering honors the RLS settings.
What should you do?
Question 98
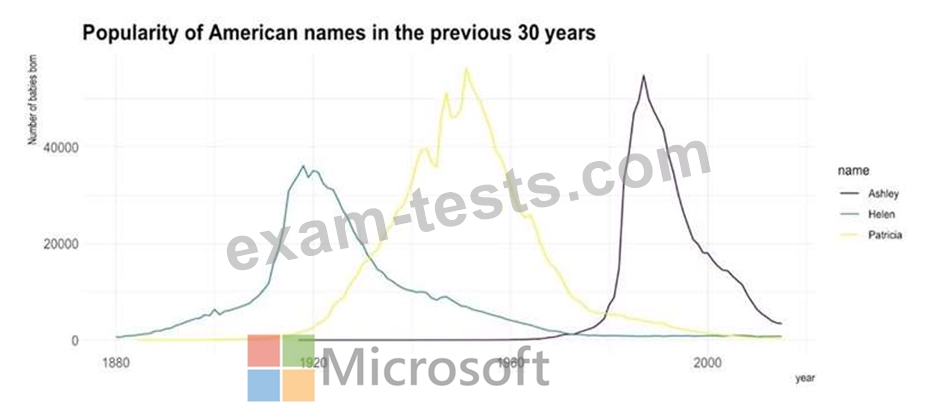
You need to create a visualization that compares revenue and cost over time.
Which type of visualization should you use?
Which type of visualization should you use?
Question 99
In the Power BI service, you create an app workplace that contains several dashboards.
You need to provide a user named [email protected] with the ability to edit and publish dashboards.
What should you do?
You need to provide a user named [email protected] with the ability to edit and publish dashboards.
What should you do?
Question 100
You build a report to help the sales team understand its performance and the drivers of sales. The team needs to have a single visualization to identify which factors affect success .
Which type of visualization should you use?
Which type of visualization should you use?