
Question 36
You have a Power BI report that uses a dataset based on an Azure Analysis Services live connection.
You need to ensure that users can use Q&A from the Power BI service for the dataset.
What should you do?
You need to ensure that users can use Q&A from the Power BI service for the dataset.
What should you do?
Question 37
You have the tables shown in the following table.
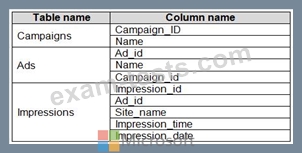
The Impressions table contains approximately 30 million records per month.
You need to create an ad analytics system to meet the following requirements:
Present ad impression counts for the day, campaign, and Site_name. The analytics for the last year are required.
Minimize the data model size.
Which two actions should you perform? Each correct answer presents part of the solution.
NOTE: Each correct selection is worth one point.
Question 38
You need to create a Power Bl report. The first page or the report must contain the following two views:
* Sales By Postal Code
* Sales by Month
Both views must display a slicer to select a value for a field named Chain.
The Sales By Postal Code view must display a map visual as shown in the following exhibit.
* Sales By Postal Code
* Sales by Month
Both views must display a slicer to select a value for a field named Chain.
The Sales By Postal Code view must display a map visual as shown in the following exhibit.
Question 39
You receive revenue data that must be included in Microsoft Power Bl reports.
You perform an initial load of the data from a Microsoft Excel source as shown in the following exhibit.
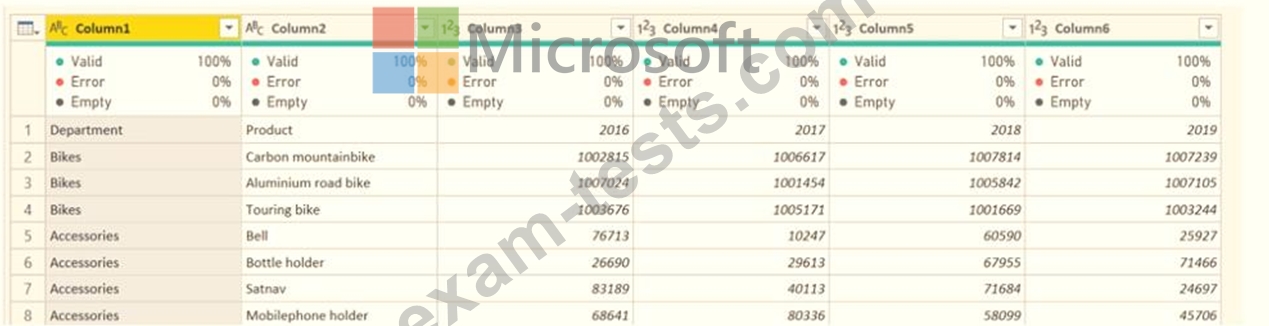
You plan to create several visuals from the data, including a visual that shows revenue split by year and product.
You need to transform the data to ensure that you can build the visuals. The solution must ensure that the columns are named appropriately for the data that they contain.
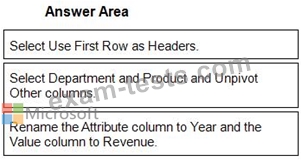
Which three actions should you perform in sequence? To answer, move the appropriate actions from the list of actions to the answer area and arrange them in the correct order.
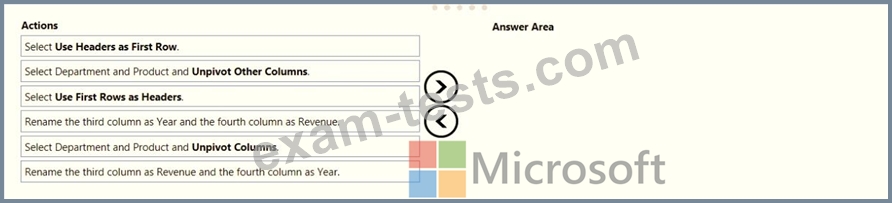
You perform an initial load of the data from a Microsoft Excel source as shown in the following exhibit.
You plan to create several visuals from the data, including a visual that shows revenue split by year and product.
You need to transform the data to ensure that you can build the visuals. The solution must ensure that the columns are named appropriately for the data that they contain.
Which three actions should you perform in sequence? To answer, move the appropriate actions from the list of actions to the answer area and arrange them in the correct order.
Question 40
You have a table that contains sales data and approximately 1,000 rows.
You need to identify outliers in the table. Which type of visualization should you use?
You need to identify outliers in the table. Which type of visualization should you use?