Question 26
You import two Microsoft Excel tables named Customer and Address into Power Query Customer contains the following columns:
* Customer ID
* Customer Name
* Phone
* Email Address
* Address ID
Address contains the following columns:
* Address ID
* Address Line 1
* Address Line 2
* City
* State/Region
* Country
* Postal Code
Each Customer ID represents a unique customer m the Customer table. Each Address ID represents a unique address m the Address table. You need to create a query that has one row per customer. Each row must contain City. State/Region, and Country for each customer. What should you do?
Question 27
You publish a report to a workspace named Customer Services. The report identifies customers that have potential data quality issues that must be investigated by the customer services department of your company.
You need to ensure that customer service managers can create task lists in Microsoft Excel based on the data.
Which report setting should you configure?
You need to ensure that customer service managers can create task lists in Microsoft Excel based on the data.
Which report setting should you configure?
Question 28
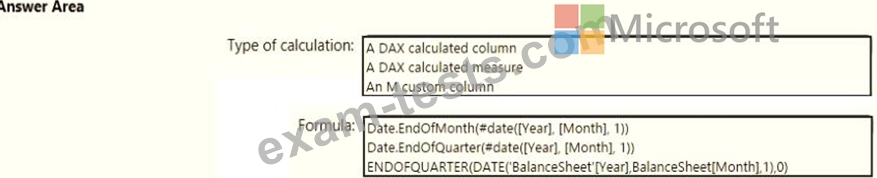
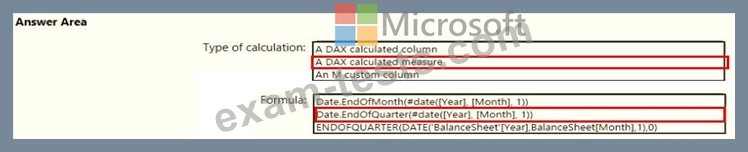
You need to calculate the last day of the month in the balance sheet data to ensure that you can relate the balance sheet data to the Date table. Which type of calculation and which formula should you use? To answer, select the appropriate options in the answer are a. NOTE: Each correct selection is worth one point.
Question 29
You have four sales regions. Each region has multiple sales managers.
You implement row-level security (RLS) in a data model. You assign the relevant distribution lists to each role.
You have sales reports that enable analysis by region. The sales managers can view the sales records of their region. The sales managers are prevented from viewing records from other regions.
A sales manager changes to a different region.
You need to ensure that the sales manager can see the correct sales data.
What should you do?
Question 30
You are creating a Power Bi model and report.
You have a single table in a data mode) named Product Product contains the following fields:
* ID
* Name
* Color
* Category
* Total Sales
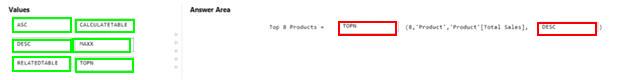
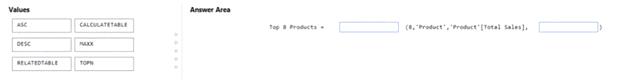
You need to create a calculated table that shows only the top eight products based on the highest value in Total Sales.
How should you complete the DAX expression? To answer, drag the appropriate values to the coned targets. Each value may be used once, more than once, or not at all. You may need to drag the split bar between panes or scroll to view content.
You have a single table in a data mode) named Product Product contains the following fields:
* ID
* Name
* Color
* Category
* Total Sales
You need to create a calculated table that shows only the top eight products based on the highest value in Total Sales.
How should you complete the DAX expression? To answer, drag the appropriate values to the coned targets. Each value may be used once, more than once, or not at all. You may need to drag the split bar between panes or scroll to view content.