
Question 21
You build a Power Bi report that displays loT temperature data streaming from a refrigerator.
You publish the report to the Power BI service.
You need to be notified when the temperature rises above four degrees Celsius.
What should you do?
You publish the report to the Power BI service.
You need to be notified when the temperature rises above four degrees Celsius.
What should you do?
Question 22
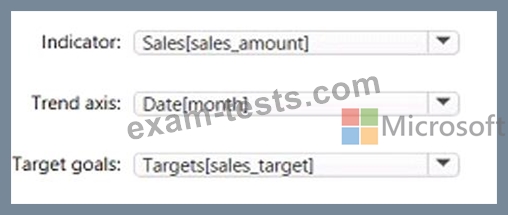
You need to create a visualization to meet the reporting requirements of the sales managers.
HOW Should create the Visualization? TO answer, select the appropriate options in the answer are
HOW Should create the Visualization? TO answer, select the appropriate options in the answer are
Question 23
You are developing a report page. Some users will navigate the report by using a keyboard, and some users will consume the report by using a screen reader. You need to ensure that the users can consume the content on a report page in a logical order. What should you configure in Microsoft Power Bl Desktop?
Question 24
You have multiple dashboards.
You need to ensure that when users browse the available dashboards from powerbi.com. they can see which dashboards contain Personally Identifiable Information (Pll). The solution must minimize configuration effort and impact on the dashboard design.
What should you use?
You need to ensure that when users browse the available dashboards from powerbi.com. they can see which dashboards contain Personally Identifiable Information (Pll). The solution must minimize configuration effort and impact on the dashboard design.
What should you use?
Question 25
For the sales department at your company, you publish a Power Bl report that imports data from a Microsoft Excel We located in a Microsoft SharePoint folder The data model contains several measures You need to create a Power Bl report from the existing dat a. The solution must minimize development effort. Which type ol data source should you use?