
Question 36
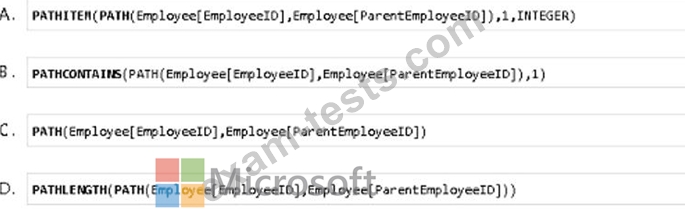
Each employee has one manager as shown in the ParentEmployeelD column,
All reporting paths lead to the CEO at the top of the organizational hierarchy.
You need to create a calculated column that returns the count of levels from each employee to the CEO.
Which DAX expression should you use?
All reporting paths lead to the CEO at the top of the organizational hierarchy.
You need to create a calculated column that returns the count of levels from each employee to the CEO.
Which DAX expression should you use?
Question 37
You have a report that contains a donut chart and a clustered column chart. Interactions between the visuals use the default settings.
You need to modify the report so that when you select a column m the column chart, the donut chart redraws by using the data from the selected column.
What should you do?
You need to modify the report so that when you select a column m the column chart, the donut chart redraws by using the data from the selected column.
What should you do?
Question 38
Note: This question is a part of a series of questions that present the same scenario. For your convenience, the scenario is repeated in each question. Each question presents a different goal and answer choices, but the text of the scenario is exactly the same in each question in this series.
Start of repeated scenario
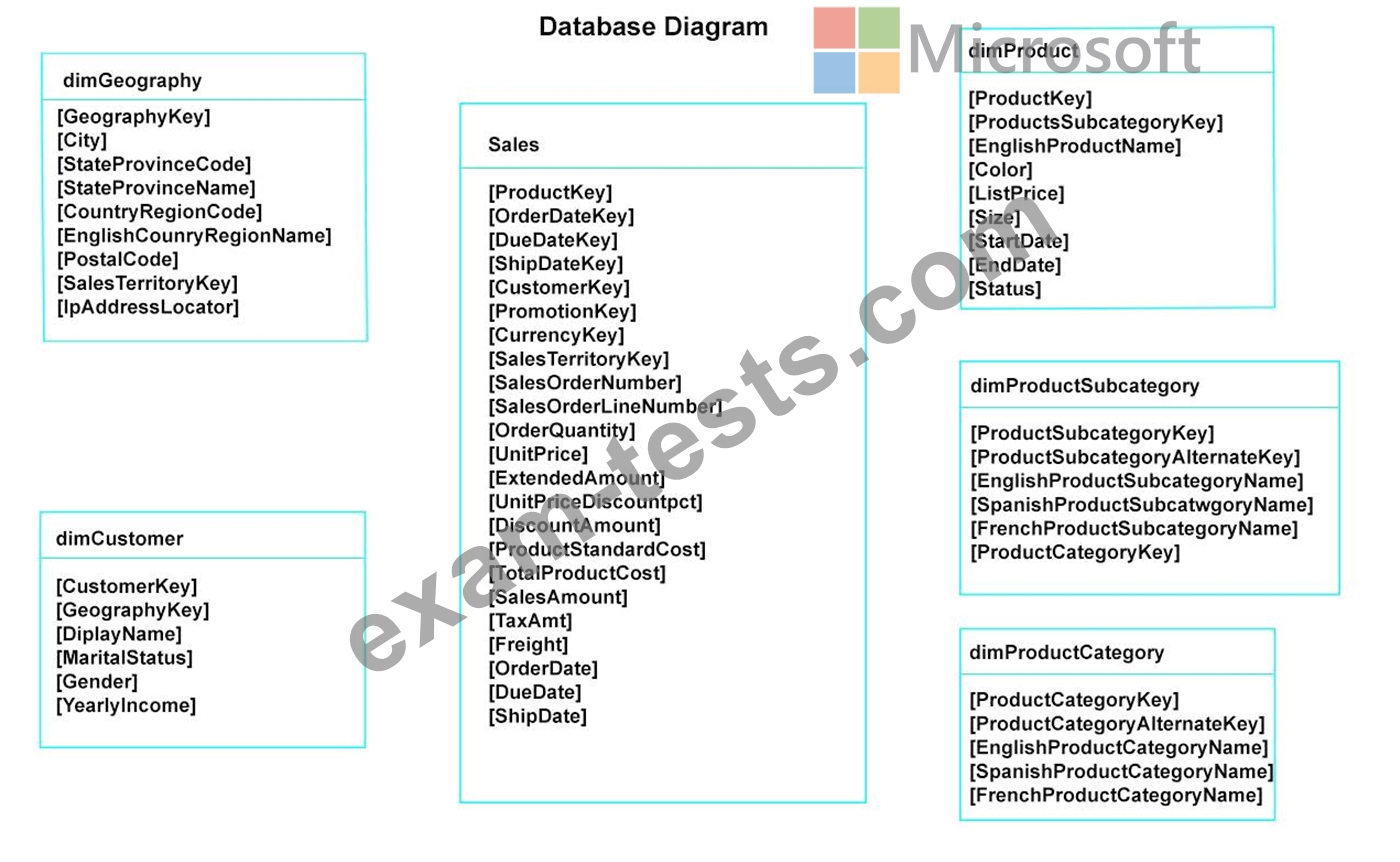
You have a Microsoft SQL Server database that has the tables shown in the Database Diagram exhibit. (Click the Exhibit.)
You plan to develop a Power BI model as shown in the Power BI Model exhibit. (Click the Exhibit).

You plan to use Power BI to import data from 2013 to 2015.
Product Subcategory [Subcategory] contains NULL values.
End of repeated scenario.
You implement the Power BI model.
You need to add a measure to rank total sales by product. The results must appear as shown in the following table.

Which DAX formula should you use?
Start of repeated scenario
You have a Microsoft SQL Server database that has the tables shown in the Database Diagram exhibit. (Click the Exhibit.)
You plan to develop a Power BI model as shown in the Power BI Model exhibit. (Click the Exhibit).
You plan to use Power BI to import data from 2013 to 2015.
Product Subcategory [Subcategory] contains NULL values.
End of repeated scenario.
You implement the Power BI model.
You need to add a measure to rank total sales by product. The results must appear as shown in the following table.
Which DAX formula should you use?
Question 39
You have a Power BI report named Report' and a dashboard named Dashboard'. Report1 contains a line chart named Sales by month.
You pin the Sales by month visual to Dashboard1.
In Report1, you change the Sales by month visual to a bar chart.
You need to ensure that the bar chart displays on Dashboard',
What should you do?
You pin the Sales by month visual to Dashboard1.
In Report1, you change the Sales by month visual to a bar chart.
You need to ensure that the bar chart displays on Dashboard',
What should you do?
Question 40
In Power Bi Desktop, you are creating visualizations in a report based on an imported dataset You need to allow Power Bi users to export the summarized data used to create the visualizations but prevent the users from exporting the underlying data What should you do?