Question 46
You are building a Power Bl report that uses data from an Azure SQL database named erp1.
You Import the following tables.

You need to perform the following analyses:
* Orders sold over time that include a measure of the total order value
* Orders by attributes of products sold
The solution must minimize update times when interacting with visuals in the report. What should you do first?
You Import the following tables.
You need to perform the following analyses:
* Orders sold over time that include a measure of the total order value
* Orders by attributes of products sold
The solution must minimize update times when interacting with visuals in the report. What should you do first?
Question 47
What should you create to meet the reporting requirements of the sales department?
Question 48
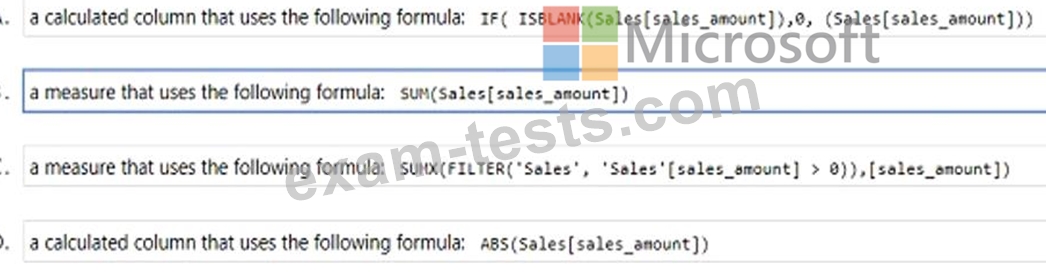
You have a Power B1 data model that contains two tables named Products and Sales.
A one-to-many relationship exists between the tables.
You have a report that contains a report-level filter for Products.
You need to create a measure that will return the percent of total sales for each product. The measure must respect the report-level filter when calculating the total.
How should you complete the DAX measure? To answer drag the appropriate DAX functions to the correct targets- Each function may be used once, more than once, or not at all the spirt bar between panes or scroll to view content NOTE: Each correct selection is worth one point
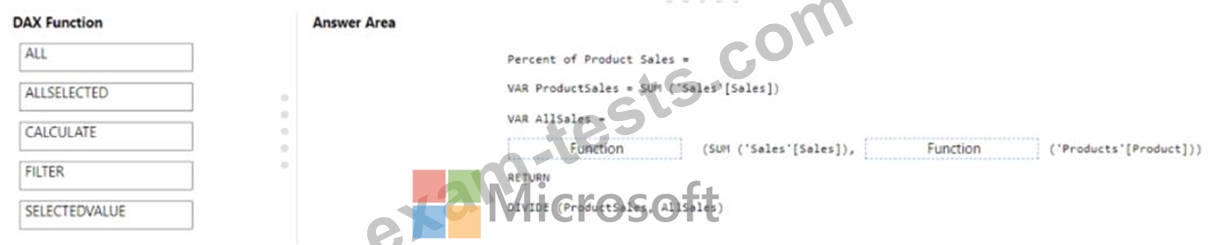
Question 49
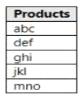
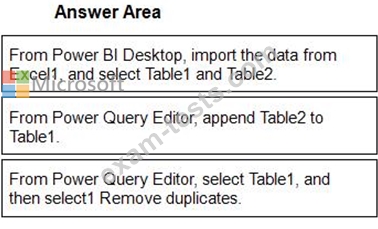
You have a Microsoft Excel workbook that contains two sheets named Sheet1 and Sheet2. Sheet1 contains the following table named Table1.
Sheet2 contains the following table named Table2.
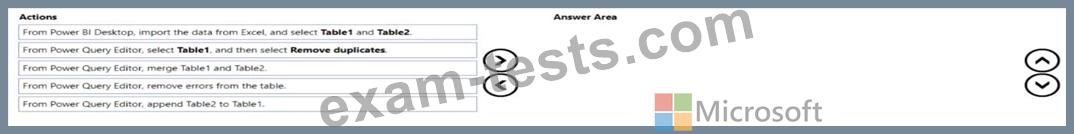
Sheet2 contains the following table named Table2.
Question 50
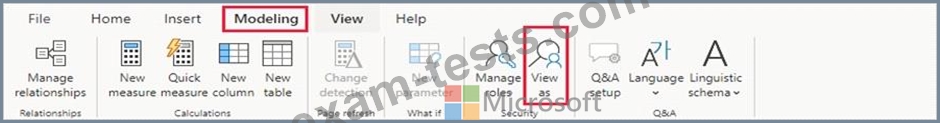
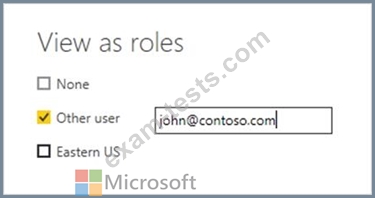
You have five sales regions. Each region is assigned a single salesperson.
You have an imported dataset that has a dynamic row-level security (RLS) role named Sales. The Sales role filters sales transaction data by salesperson.
Salespeople must see only the data from their region.
You publish the dataset to powerbi.com, set RLS role membership, and distribute the dataset and related reports to the salespeople.
A salesperson reports that she believes she should see more data.
You need to verify what data the salesperson currently sees.
What should you do?