
Question 51
Each employee has one manager as shown in the ParentEmployeelD column,
All reporting paths lead to the CEO at the top of the organizational hierarchy.
You need to create a calculated column that returns the count of levels from each employee to the CEO.
Which DAX expression should you use?
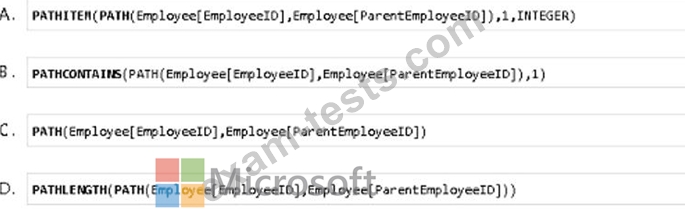
All reporting paths lead to the CEO at the top of the organizational hierarchy.
You need to create a calculated column that returns the count of levels from each employee to the CEO.
Which DAX expression should you use?
Question 52
You build a report to help the sales team understand its performance and the drivers of sales. The team needs to have a single visualization to identify which factors affect success. Which type of visualization should you use?
Question 53
You need to create a solution to meet the notification requirements of the warehouse shipping department.
What should you do? To answer, select the appropriate options in the answer area.
NOTE: Each correct select is worth one point:

What should you do? To answer, select the appropriate options in the answer area.
NOTE: Each correct select is worth one point:

Question 54
You have two CSV files named Products and Categories. The Products file contains the following columns:
* ProductID
* ProduetName
* SupplierID
* CategoryID
The Categories file contains the following columns:
From Power Bl Desktop, you import the files into Power Query Editor.
You need to create a Power Bl dataset that will contain a single table named Product. The Product will table includes the following columns:

Question 55
You have the dataset shown in the following exhibit.
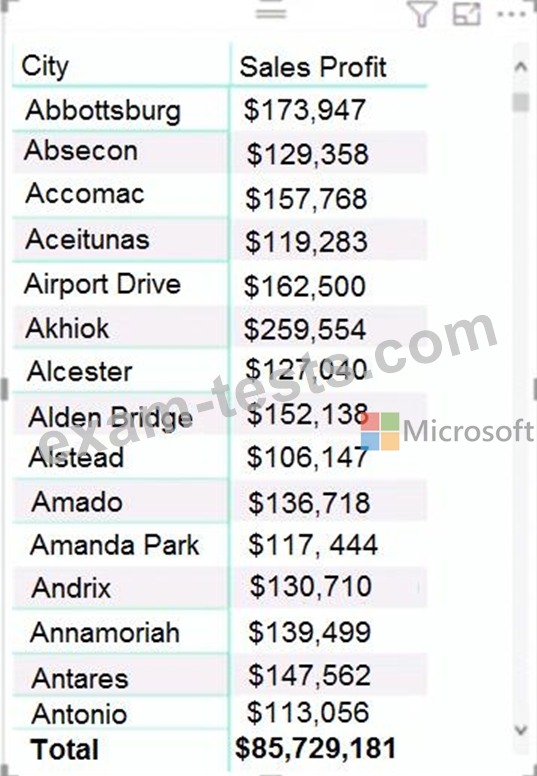
You need to ensure that the visual shows only the 10 cities that have the highest sales profit.
What should you do?
You need to ensure that the visual shows only the 10 cities that have the highest sales profit.
What should you do?