
Question 76
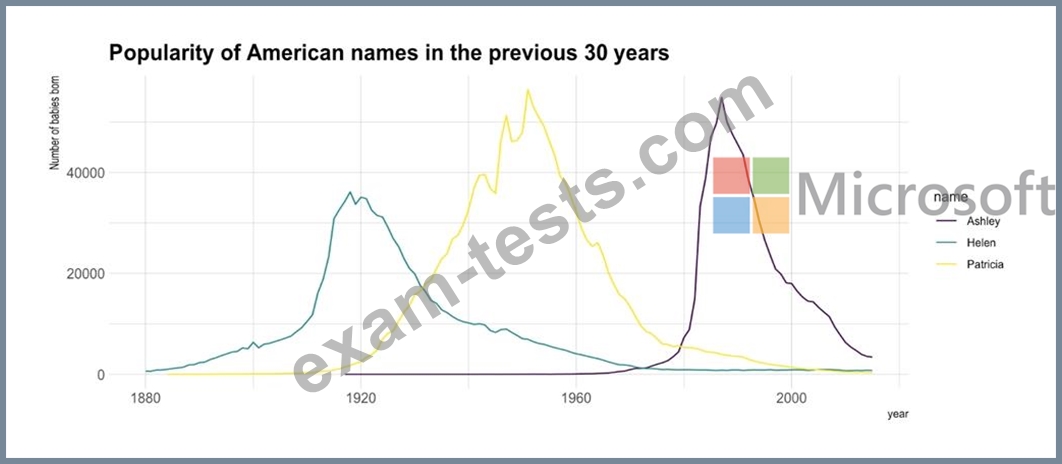
You need to create a visualization that compares revenue and cost over time.
Which type of visualization should you use?
Which type of visualization should you use?
Question 77
You have a prospective customer list that contains 1,500 rows of data. The list contains the following fields:
* First name
* Last name
* Email address
* State/Region
* Phone number
You import the list into Power Query Editor.
You need to ensure that the list contains records for each State/Region to which you want to target a marketing campaign.
Which two actions should you perform? Each correct answer presents part of the solution.
NOTE: Each correct selection is worth one point.
Question 78
You have a folder that contains 100 CSV files.
You need to make the file metadata available as a single dataset by using Power Bi The solution must NOT store the data of the CSV files.
Which three actions should you perform in sequence. To answer, mow the appropriate actions from the list of actions to the answer area and arrange them m the correct order.
NOTE; More than one order of answer choices is correct. You will receive credit for any of the correct orders you select.

Question 79
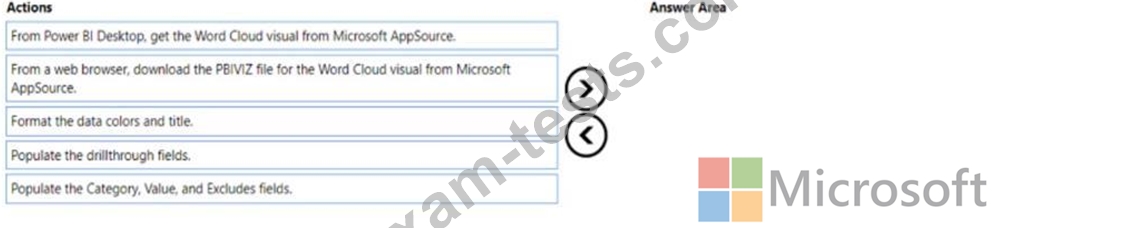
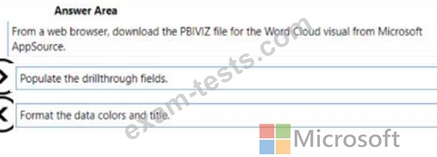
You use Power Bi Desktop to create a Power Bl data model and a blank report You need to add the Word Cloud visual shown in the following exhibit to the report.

The solution must minimize development effort
Which three actions should you perform in sequence? To answer, move the appropriate actions from the list of actions to the answer area and arrange them in the correct order.
The solution must minimize development effort
Which three actions should you perform in sequence? To answer, move the appropriate actions from the list of actions to the answer area and arrange them in the correct order.
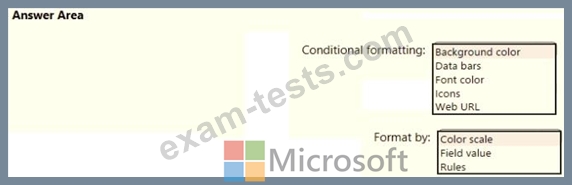
Question 80
You need to create a visual as shown in the following exhibit.
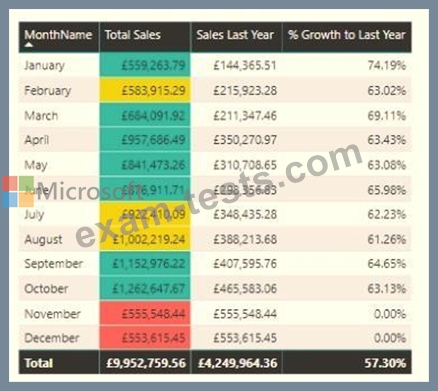
The indicator color for Total Sales will be based on % Growth to Last Year.
The solution must use the existing calculations only.
How should you configure the visual? To answer, select the appropriate options in the answer area.
NOTE: Each correct selection is worth one point.
The indicator color for Total Sales will be based on % Growth to Last Year.
The solution must use the existing calculations only.
How should you configure the visual? To answer, select the appropriate options in the answer area.
NOTE: Each correct selection is worth one point.