
Question 36
You have a collection of reports for the HR department of your company.
You need to create a visualization for the HR department that shows a historic employee counts and predicts trends during the next six months.
Which type of visualization should you use?
You need to create a visualization for the HR department that shows a historic employee counts and predicts trends during the next six months.
Which type of visualization should you use?
Question 37
You are building a Power BI report to analyze customer segments.
You need to identify customer segments dynamically based on the Bounce Rate across dimensions such as source, geography, and demographics. The solution must minimize analysis effort.
Which type of visualization should you use?
You need to identify customer segments dynamically based on the Bounce Rate across dimensions such as source, geography, and demographics. The solution must minimize analysis effort.
Which type of visualization should you use?
Question 38
You need to recommend a strategy to consistently define the business unit, department, and product category data and make the data usable across reports.
What should you recommend?
What should you recommend?
Question 39
You are profiling data by using Power Query Editor.
The AddressLine2 column in a table named Address is shown in the following exhibit.
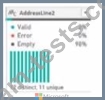
Use the drop-down menus to select the answer choice that completes each statement based on the information presented in the graphic.
NOTE: Each correct selection is worth one point.
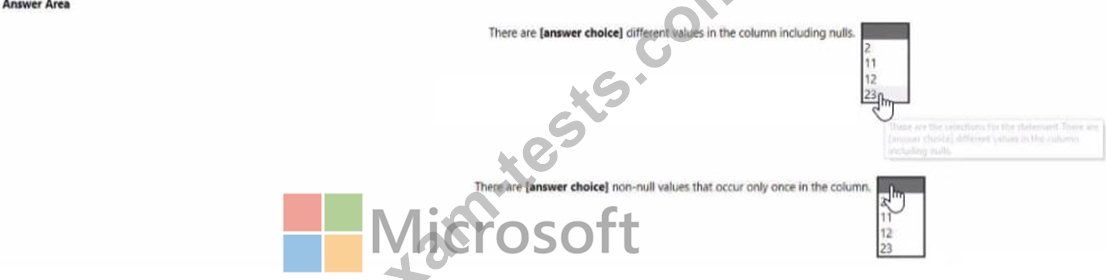
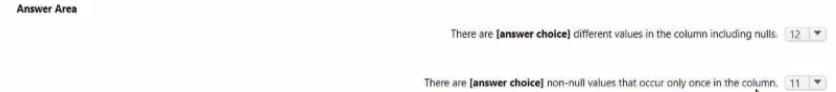
The AddressLine2 column in a table named Address is shown in the following exhibit.
Use the drop-down menus to select the answer choice that completes each statement based on the information presented in the graphic.
NOTE: Each correct selection is worth one point.
Question 40
You need to create the dataset. Which dataset mode should you use?