
Question 11
ion have a Power BI dataset that contains a table named Temperature Readings. Temperature Readings contains the columns shown in the following table.
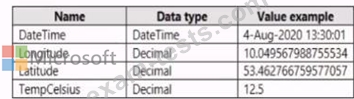
The table has 12 million rows. All the columns are needed for analysis.
You need to optimize the dataset to decrease the model size. The solution must not affect the precision of the data.
What should you do?
The table has 12 million rows. All the columns are needed for analysis.
You need to optimize the dataset to decrease the model size. The solution must not affect the precision of the data.
What should you do?
Question 12
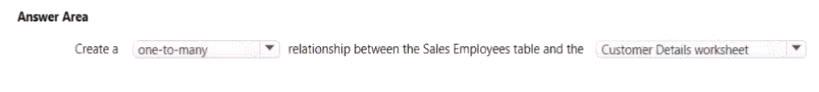
You need to create a relationship in the dataset for RLS.
What should you do? To answer select the appropriate options in the answer area.
NOTE: Each correct selection is worth one point.
What should you do? To answer select the appropriate options in the answer area.
NOTE: Each correct selection is worth one point.
Question 13
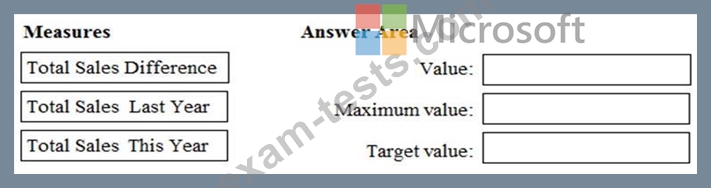
You have a Power BI model that contains a table named Sales. Sales has the following three measures:
* A measure named Total Sales Last Year that displays the sales from the previous calendar year. The current value is 32.89 million.
* A measure named Total Sales This Year that displays the sales from the current calendar year. The current value is 11.69 million.
* A measure named Total Sales Difference that uses a DAX formula of Sales[Last Year] - Sales[This Year].
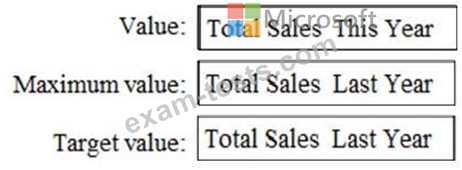
You need to create the following visualization.

How should you configure the visualization? To answer, drag the appropriate measures to the correct fields.
Each value may be used once, more than once, or not at all. You may need to drag the split bar between panes or scroll to view content.
NOTE: Each correct selection is worth one point.
* A measure named Total Sales Last Year that displays the sales from the previous calendar year. The current value is 32.89 million.
* A measure named Total Sales This Year that displays the sales from the current calendar year. The current value is 11.69 million.
* A measure named Total Sales Difference that uses a DAX formula of Sales[Last Year] - Sales[This Year].
You need to create the following visualization.
How should you configure the visualization? To answer, drag the appropriate measures to the correct fields.
Each value may be used once, more than once, or not at all. You may need to drag the split bar between panes or scroll to view content.
NOTE: Each correct selection is worth one point.
Question 14
You have a Power Bi report. The report contains a visual that snows gross sales by date The visual has anomaly detection enabled.
No anomalies ate detected
You need to increase the likelihood that anomaly detection will identify anomalies in the report.
What should you do?
No anomalies ate detected
You need to increase the likelihood that anomaly detection will identify anomalies in the report.
What should you do?
Question 15
You open a query in Power Query Editor.
You need to identify the percentage of empty values in each column as quickly as possible.
Which Data Preview option should you select?
You need to identify the percentage of empty values in each column as quickly as possible.
Which Data Preview option should you select?
Premium Bundle
Newest PL-300 Exam PDF Dumps shared by BraindumpsPass.com for Helping Passing PL-300 Exam! BraindumpsPass.com now offer the updated PL-300 exam dumps, the BraindumpsPass.com PL-300 exam questions have been updated and answers have been corrected get the latest BraindumpsPass.com PL-300 pdf dumps with Exam Engine here: