
Question 66
You receive revenue data that must be included in Microsoft Power Bl reports.
You perform an initial load of the data from a Microsoft Excel source as shown in the following exhibit.

You plan to create several visuals from the data, including a visual that shows revenue split by year and product.
You need to transform the data to ensure that you can build the visuals. The solution must ensure that the columns are named appropriately for the data that they contain.
Which three actions should you perform in sequence? To answer, move the appropriate actions from the list of actions to the answer area and arrange them in the correct order.
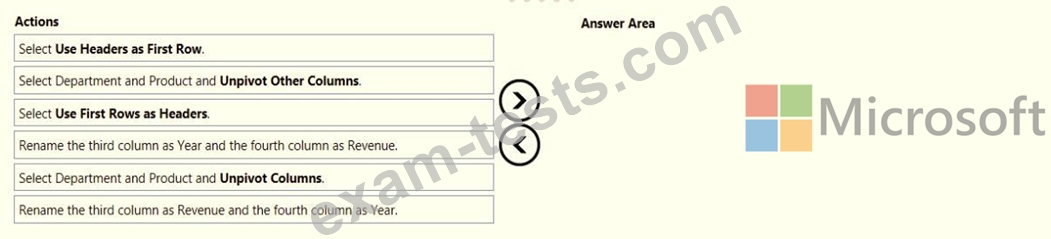
You perform an initial load of the data from a Microsoft Excel source as shown in the following exhibit.
You plan to create several visuals from the data, including a visual that shows revenue split by year and product.
You need to transform the data to ensure that you can build the visuals. The solution must ensure that the columns are named appropriately for the data that they contain.
Which three actions should you perform in sequence? To answer, move the appropriate actions from the list of actions to the answer area and arrange them in the correct order.

Question 67
You have a dataset that contains revenue data from the past year.
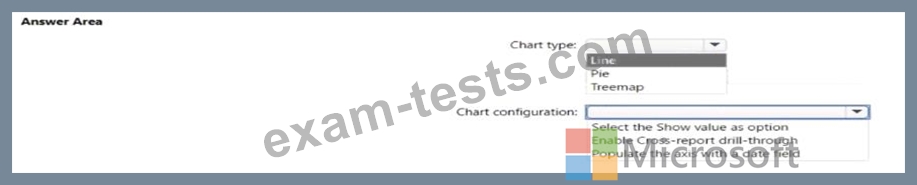
You need to use anomaly detection in Power Bl to show anomalies in the dataset.
What should you configure? To answer, select the appropriate options in the answer area.
NOTE: Each correct selection is worth one point.
You need to use anomaly detection in Power Bl to show anomalies in the dataset.
What should you configure? To answer, select the appropriate options in the answer area.
NOTE: Each correct selection is worth one point.

Question 68
You are building a financial report by using Power BI.
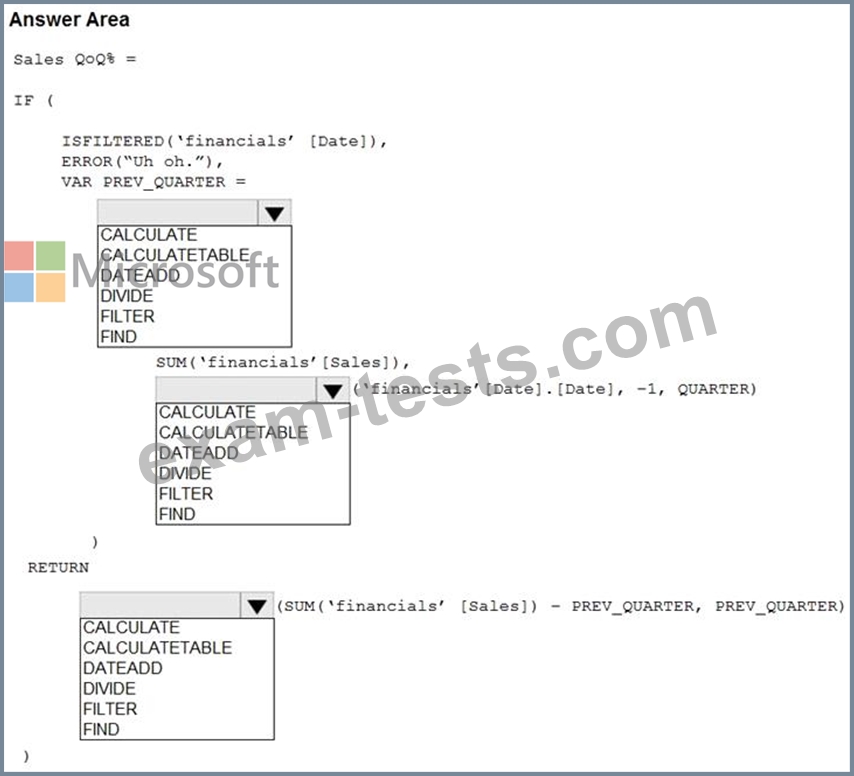
You have a table named financials that contains a column named Date and a column named Sales.
You need to create a measure that calculates the relative change in sales as compared to the previous quarter.
How should you complete the measure? To answer, select the appropriate options in the answer area.
NOTE: Each correct selection is worth one point.

Question 69
You are building a Power Bl report that uses data from an Azure SQL database named erp1.
You Import the following tables.

You need to perform the following analyses:
* Orders sold over time that include a measure of the total order value
* Orders by attributes of products sold
The solution must minimize update times when interacting with visuals in the report. What should you do first?
You Import the following tables.
You need to perform the following analyses:
* Orders sold over time that include a measure of the total order value
* Orders by attributes of products sold
The solution must minimize update times when interacting with visuals in the report. What should you do first?
Question 70
You need to create a visual that enables the adhoc exploration of data as shown in the following exhibit.

Which type of visual should you use?
Which type of visual should you use?