
Question 76
Note: This question is part of a series of questions that use the same scenario. For your convenience, the scenario is repeated in each question. Each question presents a different goal and answer choices, but the text of the scenario is the same in each question in this series.
You have a Microsoft SQL Server database that contains the following tables.

The following columns contain date information:
- Date[Month] in the mmyyyy format
- Date[Date_ID] in the ddmmyyyy format
- Date[Date_name] in the mm/dd/yyyy format
- Monthly_returns[Month_ID] in the mmyyyy format
The Order table contains more than one million rows.
The Store table has a relationship to the Monthly_returns table on the Store_ID column. This is the only relationship between the tables.
You plan to use Power BI Desktop to create an analytics solution for the data.
You need to create a relationship between the Monthly_returns table and Date[Date_ID].
What should you do before you create the relationship?
You have a Microsoft SQL Server database that contains the following tables.
The following columns contain date information:
- Date[Month] in the mmyyyy format
- Date[Date_ID] in the ddmmyyyy format
- Date[Date_name] in the mm/dd/yyyy format
- Monthly_returns[Month_ID] in the mmyyyy format
The Order table contains more than one million rows.
The Store table has a relationship to the Monthly_returns table on the Store_ID column. This is the only relationship between the tables.
You plan to use Power BI Desktop to create an analytics solution for the data.
You need to create a relationship between the Monthly_returns table and Date[Date_ID].
What should you do before you create the relationship?
Question 77
You plan to create the Power Bl model shown in the exhibit. (Click the Exhibit tab.) The data has the following refresh requirements:
* Customer must be refreshed daily.
* Date must be refreshed once every three years.
* Sales must be refreshed in near real time.
* SalesAggregate must be refreshed once per week.
You need to select the storage modes for the tables. The solution must meet the following requirements:

* Customer must be refreshed daily.
* Date must be refreshed once every three years.
* Sales must be refreshed in near real time.
* SalesAggregate must be refreshed once per week.
You need to select the storage modes for the tables. The solution must meet the following requirements:

Question 78
You are profiling data by using Power Query Editor.
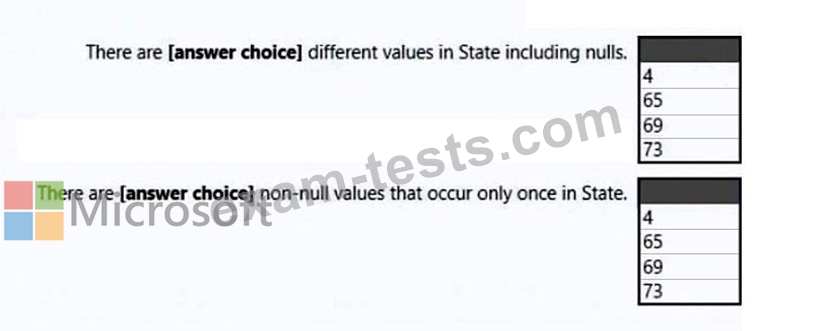
You have a table named Reports that contains a column named State. The distribution and quality data metrics for the data m State is shown in the following exhibit.

Use the drop-down menus to select the answer choice that completes each statement based on the information presented in the graphic.
NOTE: Each correct selection is worth one point.
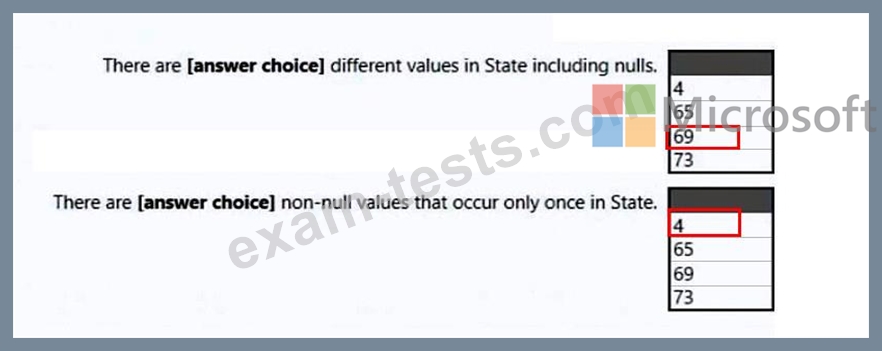
You have a table named Reports that contains a column named State. The distribution and quality data metrics for the data m State is shown in the following exhibit.
Use the drop-down menus to select the answer choice that completes each statement based on the information presented in the graphic.
NOTE: Each correct selection is worth one point.
Question 79
You have the following table named Location.

The GeoCode column represents the country where each customer is located.
You create a map visualization as shown in the exhibit. (Click the Exhibit tab.)

You need to ensure that the map displays the country locations.
What should you do?
The GeoCode column represents the country where each customer is located.
You create a map visualization as shown in the exhibit. (Click the Exhibit tab.)
You need to ensure that the map displays the country locations.
What should you do?
Question 80
HOTSPOT
You are creating a Microsoft Power BI data model that has the tables shown in the following table.

The Products table is related to the ProductCategory table through the ProductCategoryID column.
You need to ensure that you can analyze sales by product category.
How should you configure the relationships from Products to ProductCategory? To answer, select the appropriate options in the answer area. NOTE: Each correct selection is worth one point.

You are creating a Microsoft Power BI data model that has the tables shown in the following table.
The Products table is related to the ProductCategory table through the ProductCategoryID column.
You need to ensure that you can analyze sales by product category.
How should you configure the relationships from Products to ProductCategory? To answer, select the appropriate options in the answer area. NOTE: Each correct selection is worth one point.
