Question 181
You have the dataset shown in the following exhibit.

You need to ensure that the visual shows only the 10 cities that have the highest sales profit.
What should you do?
You need to ensure that the visual shows only the 10 cities that have the highest sales profit.
What should you do?
Question 182
You plan to create a Power Bl dataset to analyze attendance at a school. Data will come from two separate views named View1 and View? in an Azure SQL database. View1 contains the columns shown in the following table.

View2 contains the columns shown in the following table.

The views can be related based on the Class ID column.
Class ID is the unique identifier for the specified class, period, teacher, and school year. For example, the same class can be taught by the same teacher during two different periods, but the class will have a different class ID.
You need to design a star schema data model by using the data in both views. The solution must facilitate the following analysis:
* The count of classes that occur by period
* The count of students in attendance by period by day
* The average number of students attending a class each month
In which table should you include the Teacher First Name and Period Number fields? To answer, select the appropriate options in the answer area.
NOTE: Each correct selection is worth one point.

View2 contains the columns shown in the following table.
The views can be related based on the Class ID column.
Class ID is the unique identifier for the specified class, period, teacher, and school year. For example, the same class can be taught by the same teacher during two different periods, but the class will have a different class ID.
You need to design a star schema data model by using the data in both views. The solution must facilitate the following analysis:
* The count of classes that occur by period
* The count of students in attendance by period by day
* The average number of students attending a class each month
In which table should you include the Teacher First Name and Period Number fields? To answer, select the appropriate options in the answer area.
NOTE: Each correct selection is worth one point.

Question 183
Note: This question is a part of a series of questions that present the same scenario. For your convenience, the scenario is repeated in each question. Each question presents a different goal and answer choices, but the text of the scenario is exactly the same in each question in this series.
Start of repeated scenario
You have a Microsoft SQL Server database that has the tables shown in the Database Diagram exhibit. (Click the Exhibit.) You plan to develop a Power BI model as shown in the Power BI Model exhibit. (Click the Exhibit).
You plan to use Power BI to import data from 2013 to 2015.
Product Subcategory [Subcategory] contains NULL values.
End of repeated scenario.
You implement the Power BI model.
You add another table named Territory to the model. A sample of the data is shown in the following table.

You need to create a relationship between the Territory table and the Sales table.
Which function should you use in the query for Territory before you create the relationship?
Start of repeated scenario
You have a Microsoft SQL Server database that has the tables shown in the Database Diagram exhibit. (Click the Exhibit.) You plan to develop a Power BI model as shown in the Power BI Model exhibit. (Click the Exhibit).
You plan to use Power BI to import data from 2013 to 2015.
Product Subcategory [Subcategory] contains NULL values.
End of repeated scenario.
You implement the Power BI model.
You add another table named Territory to the model. A sample of the data is shown in the following table.
You need to create a relationship between the Territory table and the Sales table.
Which function should you use in the query for Territory before you create the relationship?
Question 184
You build a Power Bl report that displays 10T temperature data streaming from a refrigerator.
You publish the report to the Bl service.
You need to be notified when the temperature rises above four degrees Celsius.
What should you do?
You publish the report to the Bl service.
You need to be notified when the temperature rises above four degrees Celsius.
What should you do?
Question 185
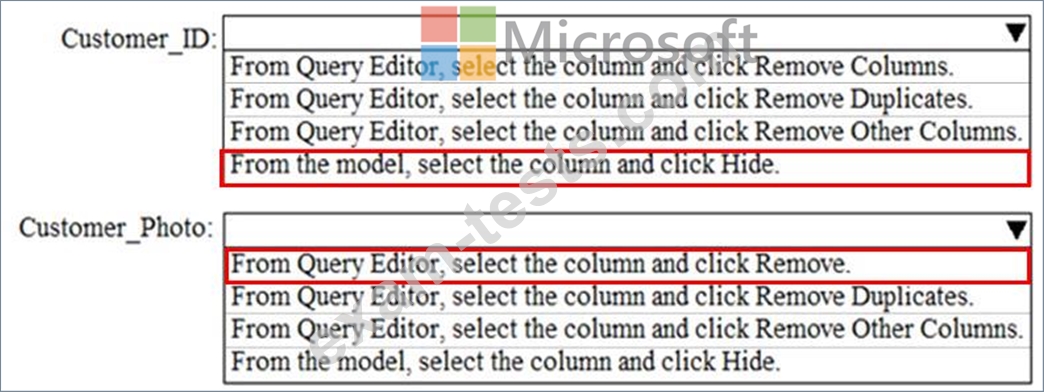
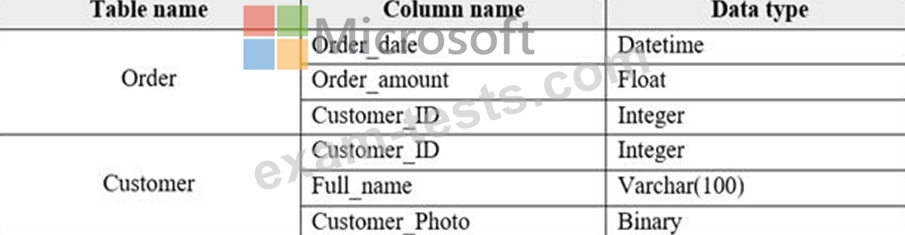
You are creating reports in Power BI Desktop. The model has the following tables.
There is a relationship between the tables.
You plan to publish a report to the Power BI service that displays Order_amount by Order_date by Full_name.
You need to ensure that only the columns required for the report appear in Report View. The solution must minimize the size of the dataset that is published.
How should you configure the columns in Power BI Desktop? To answer, select the appropriate options in the answer area.
NOTE: Each correct selection is worth one point.