
Question 216
You need to create a Power Bl report. The first page or the report must contain the following two views:
* Sales By Postal Code
* Sales by Month
Both views must display a slicer to select a value for a field named Chain.
The Sales By Postal Code view must display a map visual as shown in the following exhibit.
* Sales By Postal Code
* Sales by Month
Both views must display a slicer to select a value for a field named Chain.
The Sales By Postal Code view must display a map visual as shown in the following exhibit.

Question 217
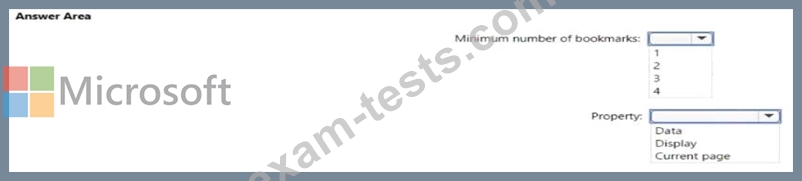
You need to create a visual that enables the adhoc exploration of data as shown in the following exhibit.

Which type of visual should you use?
Which type of visual should you use?
Question 218
You embed a Power BI report in a Microsoft SharePoint Online page.
A user name User1 can access the SharePoint Online page, but the Power BI web part displays the following error message: "This content isn't available".
User1 is unable to view the report.
You verify that you can access the SharePoint Online page and that the Power BI report displays as expected.
You need to ensure that User1 can view the report form SharePoint Online.
What should you do?
Question 219
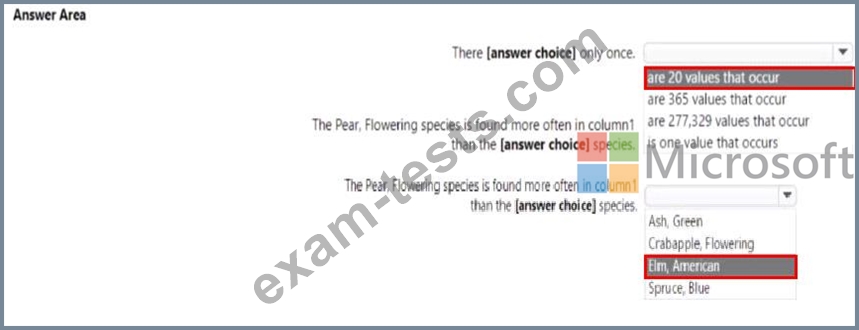
You are profiling data by using Power Query Editor.
You have a table that contains a column named column1. Column statistics and Value distribution for column1 are shown in the following exhibit.
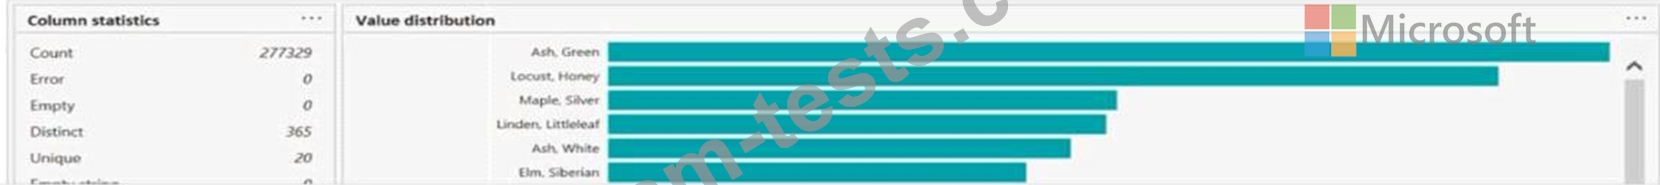
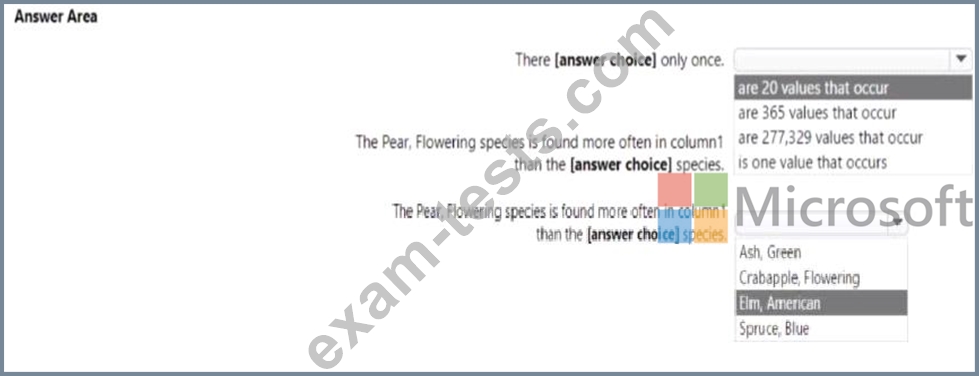
You have a table that contains a column named column1. Column statistics and Value distribution for column1 are shown in the following exhibit.
Question 220
Note: This question is a part of a series of questions that present the same scenario. For your convenience, the scenario is repeated in each question. Each question presents a different goal and answer choices, but the text of the scenario is exactly the same in each question in this series.
Start of repeated scenario
You have a Microsoft SQL Server database that has the tables shown in the Database Diagram exhibit. (Click the Exhibit.)

You plan to develop a Power BI model as shown in the Power BI Model exhibit. (Click the Exhibit).

You plan to use Power BI to import data from 2013 to 2015.
Product Subcategory [Subcategory] contains NULL values.
End of repeated scenario.
You implement the Power BI model.
You add another table named Territory to the model. A sample of the data is shown in the following table.

You need to create a relationship between the Territory table and the Sales table.
Which function should you use in the query for Territory before you create the relationship?
Start of repeated scenario
You have a Microsoft SQL Server database that has the tables shown in the Database Diagram exhibit. (Click the Exhibit.)
You plan to develop a Power BI model as shown in the Power BI Model exhibit. (Click the Exhibit).
You plan to use Power BI to import data from 2013 to 2015.
Product Subcategory [Subcategory] contains NULL values.
End of repeated scenario.
You implement the Power BI model.
You add another table named Territory to the model. A sample of the data is shown in the following table.
You need to create a relationship between the Territory table and the Sales table.
Which function should you use in the query for Territory before you create the relationship?