
Question 211
Note: This question is part of a series of questions that present the same scenario. Each question in the series contains a unique solution that might meet the stated goals. Some question sets might have more than one correct solution, while others might not have a correct solution.
After you answer a question in this section, you will NOT be able to return to it. As a result, these questions will not appear in the review screen.
From Power Query Editor, you profile the data shown in the following exhibit.

The IOT ID columns are unique to each row in query.
You need to analyze 10T events by the hour and day of the year. The solution must improve dataset performance.
Solution: You create a custom column that concatenates the 10T GUID column and the IoT ID column and then delete the IoT GUID and IoT ID columns.
Does this meet the goal?
After you answer a question in this section, you will NOT be able to return to it. As a result, these questions will not appear in the review screen.
From Power Query Editor, you profile the data shown in the following exhibit.
The IOT ID columns are unique to each row in query.
You need to analyze 10T events by the hour and day of the year. The solution must improve dataset performance.
Solution: You create a custom column that concatenates the 10T GUID column and the IoT ID column and then delete the IoT GUID and IoT ID columns.
Does this meet the goal?
Question 212
You have a Microsoft Power Bl dashboard. The report used to create the dashboard uses an imported dataset from a Microsoft SQL Server data source. The dashboard is shown in the exhibit. (Click the Exhibit tab.)

What occurred at 12:03:06 PM?
What occurred at 12:03:06 PM?
Question 213
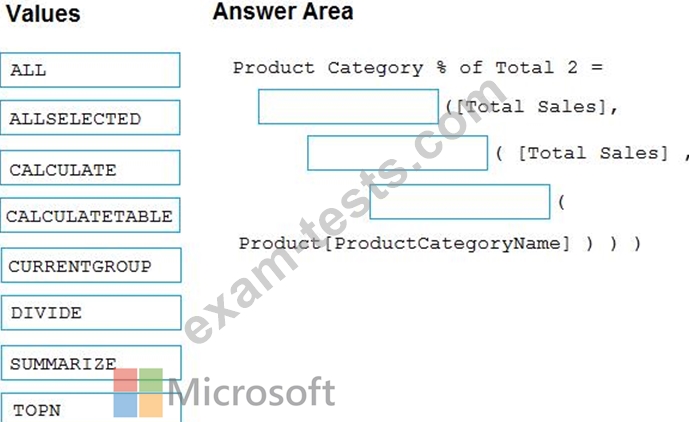
You have a Microsoft Power BI data model that contains three tables named Sales, Product, and Date.
The Sales table has an existing measure named [Total Sales] that sums the total sales from the Sales table.
You need to write a calculation that returns the percentage of total sales that a selected ProductCategoryName value represents. The calculation must respect any slicers on ProductCategoryName and must show the percentage of visible total sales. For example, if there are four ProductCategoryName values, and a user filters one out, a table showing ProductCategoryName and the calculation must sum up to 100 percent.
How should you complete the calculation? To answer, drag the appropriate values to the correct targets. Each value may be used once, more than once, or not at all. You may need to drag the split bar between panes or scroll to view content.
NOTE: Each correct selection is worth one point.

Question 214
You need to provide a user with the ability to add members to a workspace. The solution must use the principle of least privilege.
Which role should you assign to the user?
Which role should you assign to the user?

Question 215
You are profiling data by using Power Query Editor.
You have a table that contains a column named column1. Column statistics and Value distribution for column1 are shown in the following exhibit.
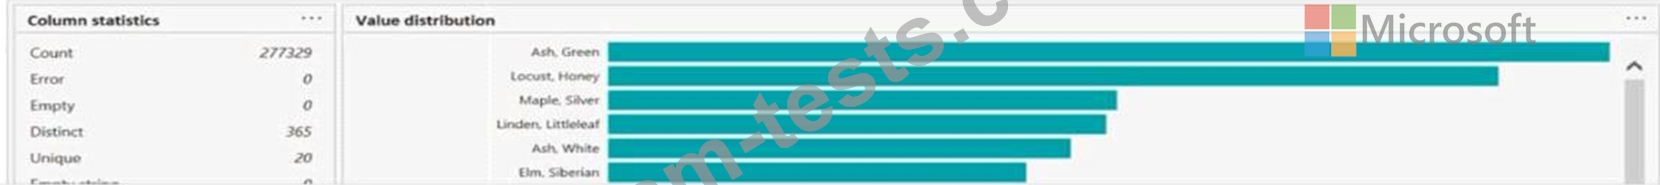
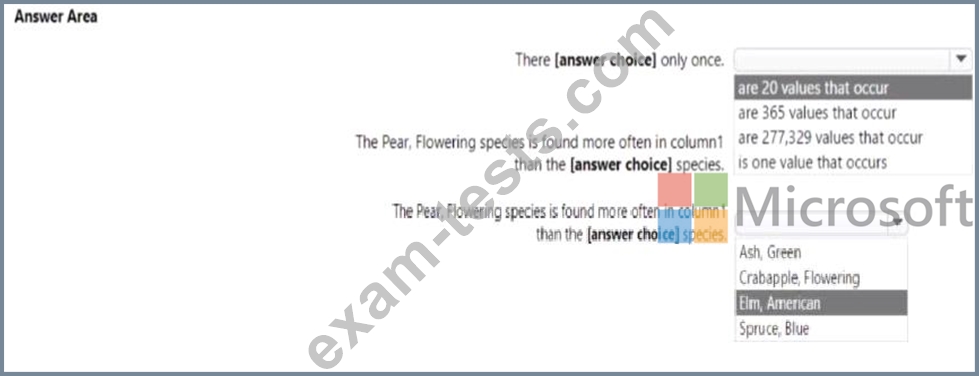
You have a table that contains a column named column1. Column statistics and Value distribution for column1 are shown in the following exhibit.

Premium Bundle
Newest PL-300 Exam PDF Dumps shared by BraindumpsPass.com for Helping Passing PL-300 Exam! BraindumpsPass.com now offer the updated PL-300 exam dumps, the BraindumpsPass.com PL-300 exam questions have been updated and answers have been corrected get the latest BraindumpsPass.com PL-300 pdf dumps with Exam Engine here: