

Question 16
You have the dashboard shown in the following exhibit.

You need to modify the dashboard to display as shown in the following exhibit.

What should you do?
You need to modify the dashboard to display as shown in the following exhibit.
What should you do?
Question 17
The data model must support the following analysis:
* Total sales by product by month in which the order was placed
* Quantities sold by product by day on which the order was placed
* Number Of sales transactions by quarter in Which the order was placed For each Of the following statements, select Yes if the statement is true. Otherwise, select NO.

* Total sales by product by month in which the order was placed
* Quantities sold by product by day on which the order was placed
* Number Of sales transactions by quarter in Which the order was placed For each Of the following statements, select Yes if the statement is true. Otherwise, select NO.


Question 18
You need to create a Power Bl report. The first page or the report must contain the following two views:
* Sales By Postal Code
* Sales by Month
Both views must display a slicer to select a value for a field named Chain.
The Sales By Postal Code view must display a map visual as shown in the following exhibit.

* Sales By Postal Code
* Sales by Month
Both views must display a slicer to select a value for a field named Chain.
The Sales By Postal Code view must display a map visual as shown in the following exhibit.

Question 19
You have two Azure SQL databases that contain the same tables and columns.
For each database, you create a query that retrieves data from a table named Customers.
You need to combine the Customer tables into a single table. The solution must minimize the size of the data model and support scheduled refresh in powerbi.com.
What should you do? To answer, select the appropriate options in the answer area.
NOTE: Each correct selection is worth one point.
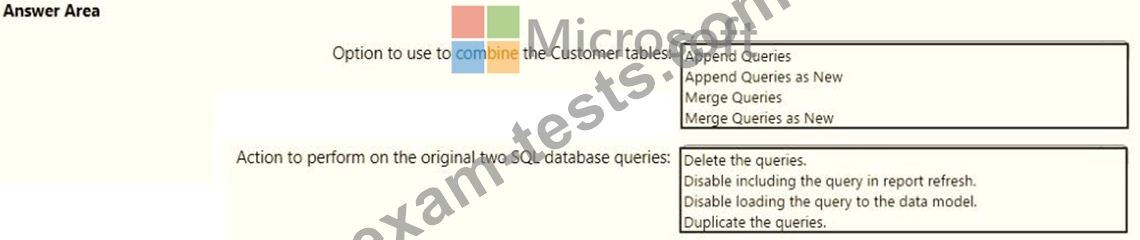
For each database, you create a query that retrieves data from a table named Customers.
You need to combine the Customer tables into a single table. The solution must minimize the size of the data model and support scheduled refresh in powerbi.com.
What should you do? To answer, select the appropriate options in the answer area.
NOTE: Each correct selection is worth one point.

Question 20
You have a table that contains the following three columns:
City
Total Sales
Occupation
You need to create a key influencers visualization as shown in the exhibit. (Click the Exhibit tab.)

How should you configure the visualization? To answer, select the appropriate options in the answer area.
NOTE: Each correct selection is worth one point.

City
Total Sales
Occupation
You need to create a key influencers visualization as shown in the exhibit. (Click the Exhibit tab.)
How should you configure the visualization? To answer, select the appropriate options in the answer area.
NOTE: Each correct selection is worth one point.

Premium Bundle
Newest PL-300 Exam PDF Dumps shared by BraindumpsPass.com for Helping Passing PL-300 Exam! BraindumpsPass.com now offer the updated PL-300 exam dumps, the BraindumpsPass.com PL-300 exam questions have been updated and answers have been corrected get the latest BraindumpsPass.com PL-300 pdf dumps with Exam Engine here: