

Question 26
You have a report in Power BI Desktop.
You add a key influencers visual as shown in the exhibit. (Click the Exhibit tab.)

Use the drop-down menus to select the answer choice that completes each statement based on the information presented in the graphic.
NOTE: Each correct selection is worth one point.

You add a key influencers visual as shown in the exhibit. (Click the Exhibit tab.)
Use the drop-down menus to select the answer choice that completes each statement based on the information presented in the graphic.
NOTE: Each correct selection is worth one point.

Question 27
In Power Query Editor, you have a query named Sales Data that contains the following columns.

You need to create two queries named Product Dimension and Sales Fact based on the Sales Data query. The solution must minimize maintenance effort and the site of the semantic model.
Which two actions should you perform? Each correct answer presents part of the solution.
NOTE Each correct selection is worth one point.
Question 28
You are building a Power Bl report that uses data from an Azure SQL database named erp1.
You Import the following tables.

You need to perform the following analyses:
* Orders sold over time that include a measure of the total order value
* Orders by attributes of products sold
The solution must minimize update times when interacting with visuals in the report. What should you do first?
You Import the following tables.
You need to perform the following analyses:
* Orders sold over time that include a measure of the total order value
* Orders by attributes of products sold
The solution must minimize update times when interacting with visuals in the report. What should you do first?
Question 29
You are profiling data by using Power Query Editor.
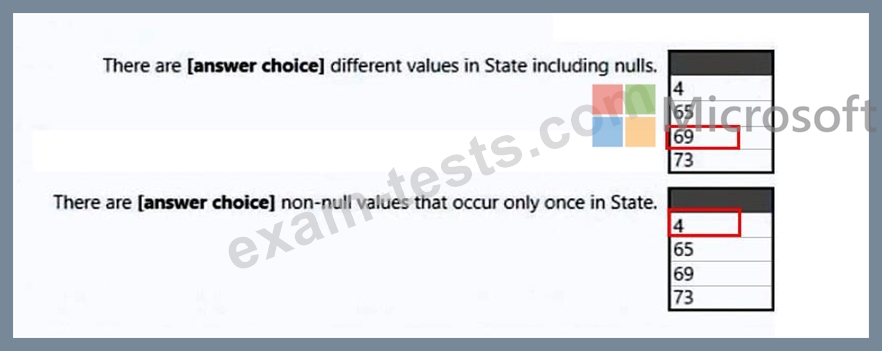
You have a table named Reports that contains a column named State. The distribution and quality data metrics for the data m State is shown in the following exhibit.

Use the drop-down menus to select the answer choice that completes each statement based on the information presented in the graphic.
NOTE: Each correct selection is worth one point.
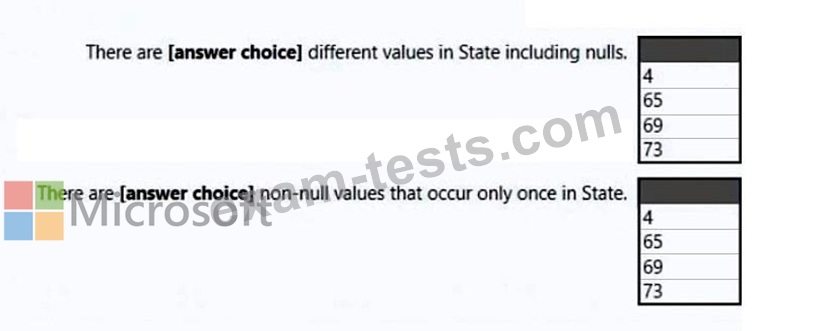
You have a table named Reports that contains a column named State. The distribution and quality data metrics for the data m State is shown in the following exhibit.
Use the drop-down menus to select the answer choice that completes each statement based on the information presented in the graphic.
NOTE: Each correct selection is worth one point.
Question 30
You are developing a report page. Some users will navigate the report by using a keyboard, and some users will consume the report by using a screen reader.
You need to ensure that the users can consume the content on a report page in a logical order.
What should you configure in Microsoft Power Bl Desktop?
You need to ensure that the users can consume the content on a report page in a logical order.
What should you configure in Microsoft Power Bl Desktop?