Question 41
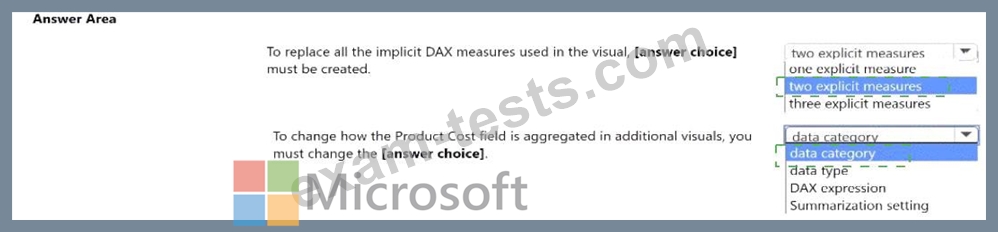
You have a Power B1 report that contains the fields shown in the following exhibit.

Use the drop-down menus to select the answer choice that completes each statement based on the information presented in the graphic.
NOTE: Each correct selection is worth one point.

Use the drop-down menus to select the answer choice that completes each statement based on the information presented in the graphic.
NOTE: Each correct selection is worth one point.

Question 42
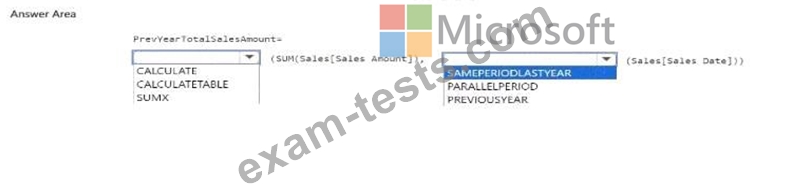
You have a semantic model that contains a table named Sales. The table contains the following columns;
* Order ID
* Product ID
* Sales Dote
* Sales Amount
You need to create a DAX measure that will return the total sales amount for the same dates from the previous ye ar. How should you complete the measure? To answer, select the appropriate options m the answer area.
NOTE: Each correct selection is worth one point.
* Order ID
* Product ID
* Sales Dote
* Sales Amount
You need to create a DAX measure that will return the total sales amount for the same dates from the previous ye ar. How should you complete the measure? To answer, select the appropriate options m the answer area.
NOTE: Each correct selection is worth one point.


Question 43
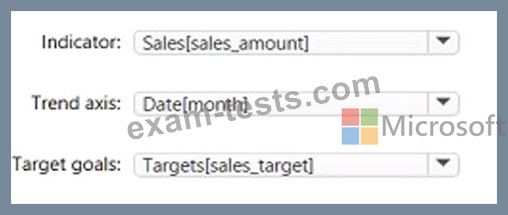
You need to create a visualization to meet the reporting requirements of the sales managers.
HOW Should create the Visualization? TO answer, select the appropriate options in the answer are a.
HOW Should create the Visualization? TO answer, select the appropriate options in the answer are a.
Question 44
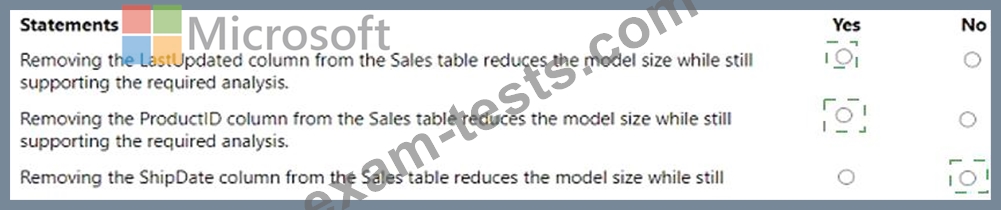
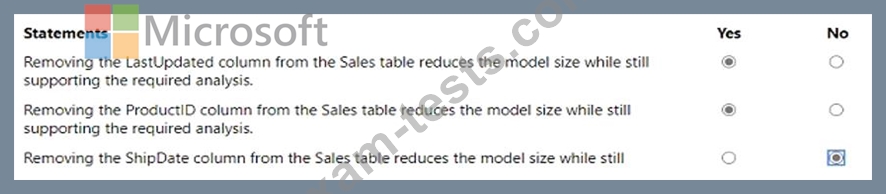
The data model must support the following analysis:
* Total sales by product by month in which the order was placed
* Quantities sold by product by day on which the order was placed
* Number Of sales transactions by quarter in Which the order was placed For each Of the following statements, select Yes if the statement is true. Otherwise, select NO.

* Total sales by product by month in which the order was placed
* Quantities sold by product by day on which the order was placed
* Number Of sales transactions by quarter in Which the order was placed For each Of the following statements, select Yes if the statement is true. Otherwise, select NO.
Question 45
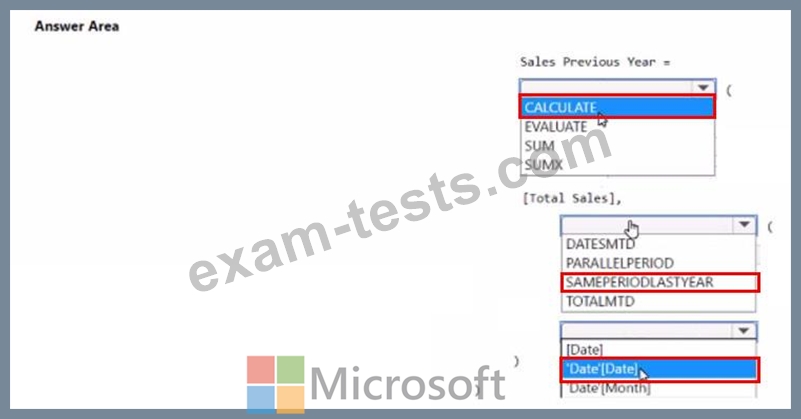
You have a Power BI model that contains a table named Sales and a related date table. Sales contains a measure named Total Sales You need to create a measure that calculates the total sales from the equivalent month of the previous year.
How should you complete the calculation? To answer, select the appropriate options in the answer area NOTE: Each correct selection is worth one point.

How should you complete the calculation? To answer, select the appropriate options in the answer area NOTE: Each correct selection is worth one point.