

Question 16
The tables have the following relationships.

You have 100 salespeople in 10,000 cities. Each salesperson sells in multiple cities.
You import one million rows into the Sales table.
You need to reduce the size of Model1. The solution must ensure that you can analyze the total number of sales by salesperson per city.
Solution: You summarize the data in the Sales table by SalesPersonID.
Does this meet the goal?
Question 17
You have the Power Bl model shown in the following exhibit.

There are four departments in the Departments table.
You need to ensure that users can see the data of their respective department only.
What should you do?
There are four departments in the Departments table.
You need to ensure that users can see the data of their respective department only.
What should you do?
Question 18
You need to create a Power BI report. The first page of the report must contain the following two views:
*Sales By Postal Code
*Sales by Month
Both views must display a slicer to select a value for a field named Chain.
The Sales By Postal Code view must display a map visual as shown in the following exhibit.
The Sales By Month view must display a column chart visual as shown in the following exhibit.
Users must be able to switch between the views by using buttons on the report page. The selected Chain field must be maintained when switching between views.
What is the minimum number of bookmarks required, and which property should you apply to each bookmark? To answer, select the appropriate options in the answer area.
NOTE: Each correct selection is worth one point.

Question 19
You have a query that returns the data shown in the following exhibit.

You need to configure the query to display the data as shown in the following exhibit.

Which step should you use in the query?
You need to configure the query to display the data as shown in the following exhibit.
Which step should you use in the query?

Question 20
Hotspot Question
You plan to create Power BI dataset to analyze attendance at a school. Data will come from two separate views named View1 and View2 in an Azure SQL database.
View1 contains the columns shown in the following table.
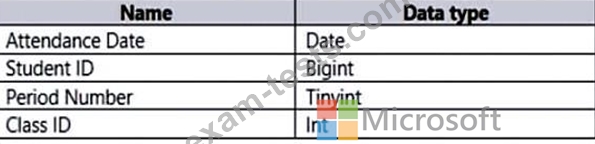
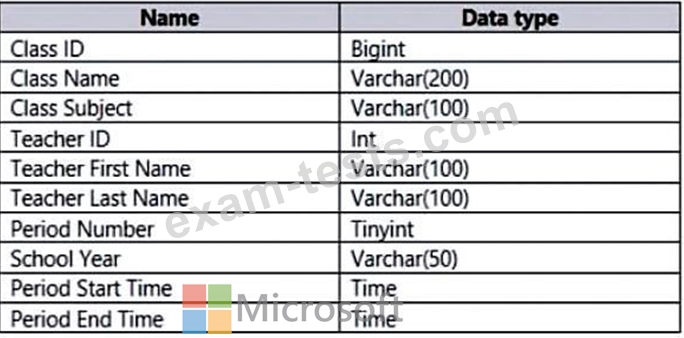
View2 contains the columns shown in the following table.
The views can be related based on the Class ID column.
Class ID is the unique identifier for the specified class, period, teacher, and school year. For example, the same class can be taught by the same teacher during two different periods, but the class will have a different class ID.
You need to design a star schema data model by using the data in both views. The solution must facilitate the following analysis:
- The count of classes that occur by period
- The count of students in attendance by period by day
- The average number of students attending a class each month
In which table should you include the Teacher First Name and Period Number fields? To answer, select the appropriate options in the answer area.
NOTE: Each correct selection is worth one point.

You plan to create Power BI dataset to analyze attendance at a school. Data will come from two separate views named View1 and View2 in an Azure SQL database.
View1 contains the columns shown in the following table.
View2 contains the columns shown in the following table.
The views can be related based on the Class ID column.
Class ID is the unique identifier for the specified class, period, teacher, and school year. For example, the same class can be taught by the same teacher during two different periods, but the class will have a different class ID.
You need to design a star schema data model by using the data in both views. The solution must facilitate the following analysis:
- The count of classes that occur by period
- The count of students in attendance by period by day
- The average number of students attending a class each month
In which table should you include the Teacher First Name and Period Number fields? To answer, select the appropriate options in the answer area.
NOTE: Each correct selection is worth one point.
